. 2015 Dec 4;350(6265):1251-5.
doi: 10.1126/science.aad2456. Epub 2015 Nov 5.

Single-cell transcriptomics reveals receptor transformations during olfactory neurogenesis

Affiliations

Single-cell transcriptomics reveals receptor transformations during olfactory neurogenesis

Naresh K Hanchate et al. Science. .

Abstract

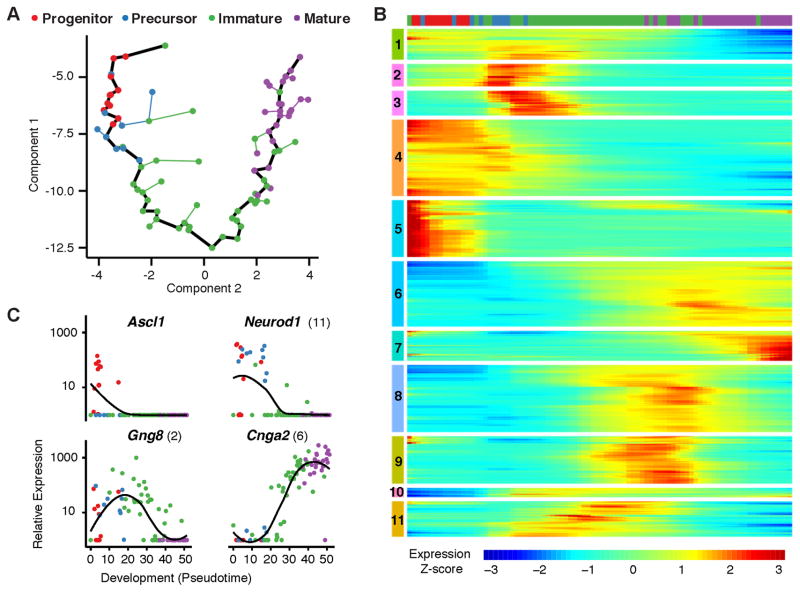
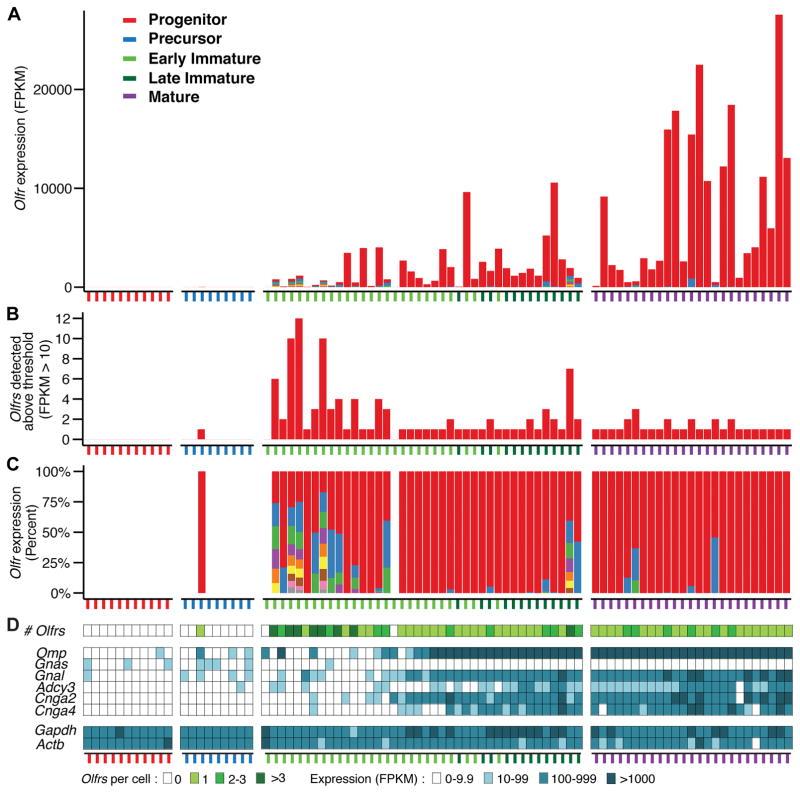
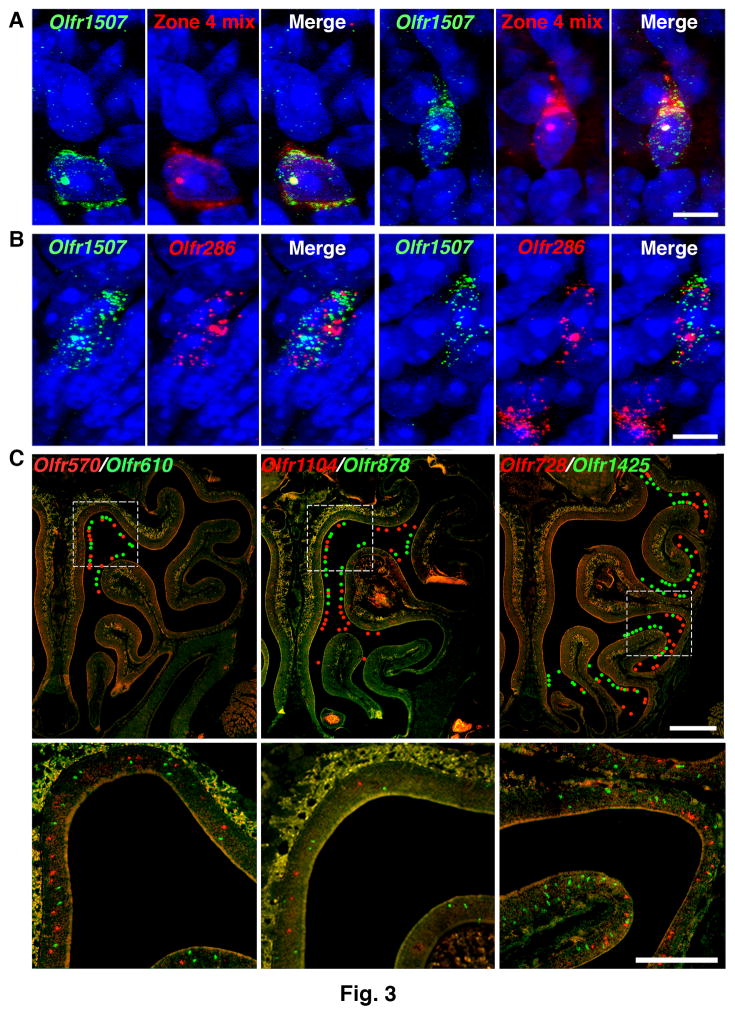
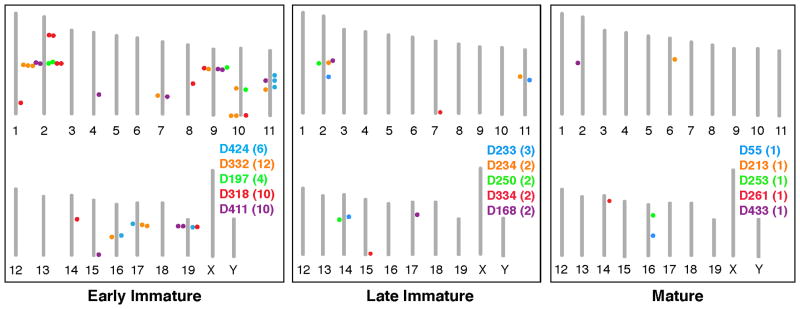
The sense of smell allows chemicals to be perceived as diverse scents. We used single-neuron RNA sequencing to explore the developmental mechanisms that shape this ability as nasal olfactory neurons mature in mice. Most mature neurons expressed only one of the ~1000 odorant receptor genes (Olfrs) available, and at a high level. However, many immature neurons expressed low levels of multiple Olfrs. Coexpressed Olfrs localized to overlapping zones of the nasal epithelium, suggesting regional biases, but not to single genomic loci. A single immature neuron could express Olfrs from up to seven different chromosomes. The mature state in which expression of Olfr genes is restricted to one per neuron emerges over a developmental progression that appears to be independent of neuronal activity involving sensory transduction molecules.


Figures

Figure 1
Figure 1. Olfactory neurons exhibit large-scale shifts in gene expression during development
A. Unsupervised analysis of single cell gene expression profiles with Monocle revealed a linear trajectory (black line) along which cells develop in a dimension referred to as “pseudotime”. Coloring of cells based on the expression of developmental markers shows that the trajectory corresponds to a stepwise development from olfactory progenitors to precursors to immature OSNs to mature OSNs. B. Global analysis of gene expression kinetics along the trajectory identified 3,830 genes that vary significantly over pseudotime development (FDR < 5% by a Tobit-valued generalized linear model likelihood ratio test; see Methods). Hierarchical clustering of these genes via Ward’s method recovered 11 non-redundant groups that covary over the trajectory. Cluster analysis indicates that multiple large shifts in gene expression occur as neurons progress through development. The bar on top shows the locations of individual cells, colored by stage of development, along this developmental trajectory. C. Kinetic diagrams show the expression of known markers of different developmental stages over the developmental progression. Parentheses indicate the groups in which genes are found in part B. Dots indicate individual cells colored according to developmental stage. Black lines indicate loess smoothing (span = 0.75, degree = 2) of log-transformed FPKM values over developmental pseudotime.
Figure 2
Figure 2. Immature neurons can express multiple Olfrs
A. Neurons assigned to different developmental stages were arranged by developmental progress, as measured in pseudotime. Early versus late immature OSNs are indicated by differently colored ticks. Different Olfrs are represented by different colors in the bars. The total number of Olfr transcripts per cell shows a steady, though variable, increase over development. B. Multiple different Olfr transcripts were detected in 13/25 early immature, 5/13 late immature, and 6/25 mature OSNs. C. The number of different Olfr transcripts per cell was highest in early immature OSNs and then declined over development. Early immature OSNs tended to express similar levels of different Olfrs. In contrast, the majority of mature OSNs expressed only one Olfr or high levels of one Olfr and low levels of one or two additional Olfrs. Each color in a bar represents a single Olfr, except gray, which represents >1 Olfr. D. Olfrs stimulate neuronal activity via mechanisms involving sensory transduction molecules encoded by Gnal (or possible Gnas in immature OSNs), Adcy3, Cnga2, and Cnga4. Five immature and six mature neurons with >1 Olfr expressed all four genes, suggesting that neuronal activity downstream of odorant receptors is not what reduces the number of Olfrs expressed per neuron. Omp, which is highly expressed in mature OSNs, was absent from six early immature OSNs with >1 Olfr, arguing against contamination from mature OSNs. Gapdh and Actb are housekeeping genes.
Figure 3
Figure 3. Olfrs expressed in the same neuron belong to a zonal gene set
A. Dual RNA-FISH of P3 tissue sections using a conventional method showed a small percentage of OSNs colabeled with an Olfr1507 probe and a mix of probes for other Olfrs expressed in the same zone (Zone 4). Cells were counterstained with DAPI (blue). Two colabeled cells are seen here, one at left and the other at right. Scale bar, 5 μm. B. Dual RNA-FISH of P3 tissue sections using a highly sensitive method showed a small percentage of OSNs coexpressing Olfr1507 and Olfr286. Two colabeled cells are seen here at left and right and a cell labeled with only one probe is also seen at right. Scale bar, 5 μm. C. Dual RNA-FISH shows that Olfrs coexpressed in single immature OSNs (Cells D200, D197, or D243) are singly expressed in neurons in the same or partially overlapping zones in adult olfactory epithelium sections. This correspondence indicates that Olfr expression in the immature OSN is restricted to a zonally-determined set of Olfr genes. Colored dots indicate the locations of labeled neurons in the upper row. Boxed areas in the upper row are shown at higher magnification in the lower row. Scale bar, 500 μm (upper row), 250 μm (lower row).
Figure 4
Figure 4. Immature neurons coexpress Olfrs from multiple chromosomal loci
Diagrams show the chromosomal locations of Olfrs expressed in single OSNs of different stages. Each mouse chromosome is indicated by a vertical bar with its number below. The names of neurons, parenthesized number of Olfrs per neuron, and dots showing the chromosomal locations of those Olfrs are shown in different colors for different neurons.

Similar articles

Cited by

References

    1. Buck L, Axel R. Cell. 1991;65:175. - PubMed
    1. Buck LB, Bargmann C. In: Principles of Neuroscience. Kandel E, Schwartz J, Jessell T, Siegelbaum S, Hudspeth AJ, editors. McGraw-Hill; New York: 2012. pp. 712–742.
    1. Zhang X, Firestein S. Nat Neurosci. 2002;5:124. - PubMed
    1. Godfrey PA, Malnic B, Buck LB. Proceedings of the National Academy of Sciences of the United States of America. 2004;101:2156. - PMC - PubMed
    1. Niimura Y, Nei M. Gene. 2005;346:13. - PubMed

Publication types

Substances

Associated data