. 2016 Jan 8;351(6269):aab2116.
doi: 10.1126/science.aab2116. Epub 2015 Nov 5.

Distinct routes of lineage development reshape the human blood hierarchy across ontogeny

Affiliations

Distinct routes of lineage development reshape the human blood hierarchy across ontogeny

Faiyaz Notta et al. Science. .

Abstract

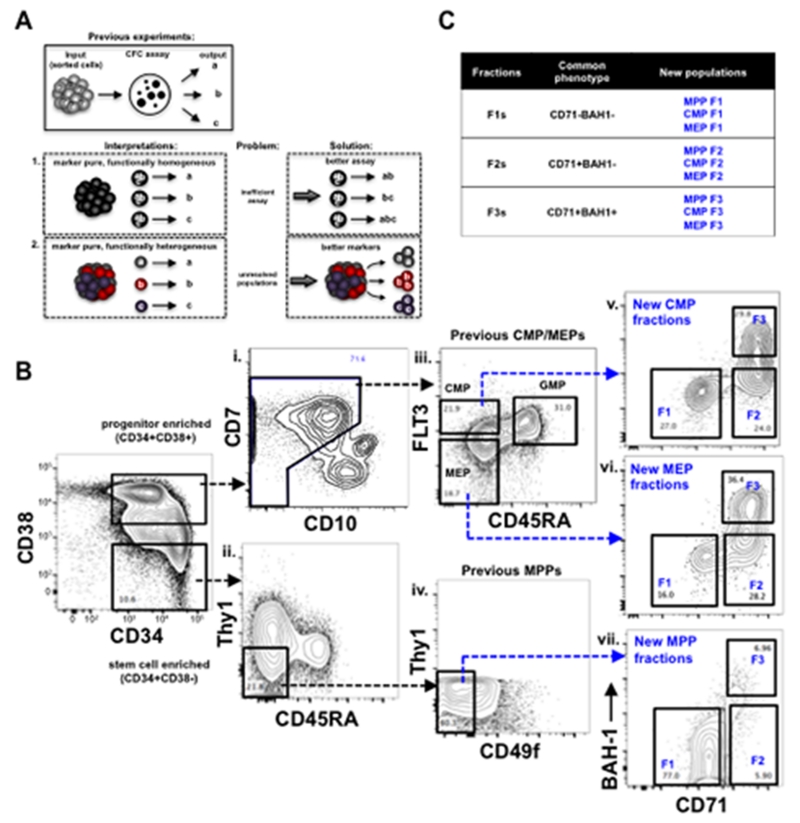
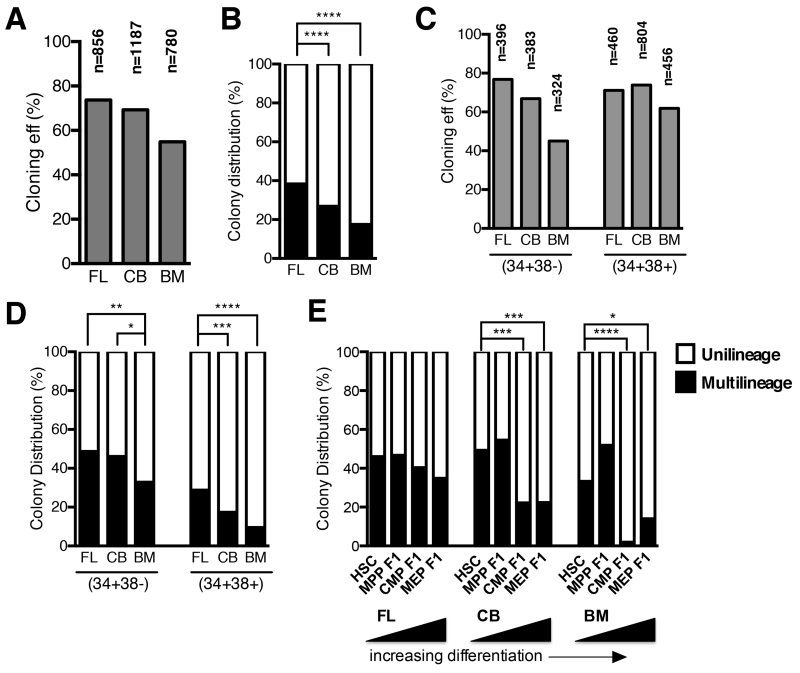
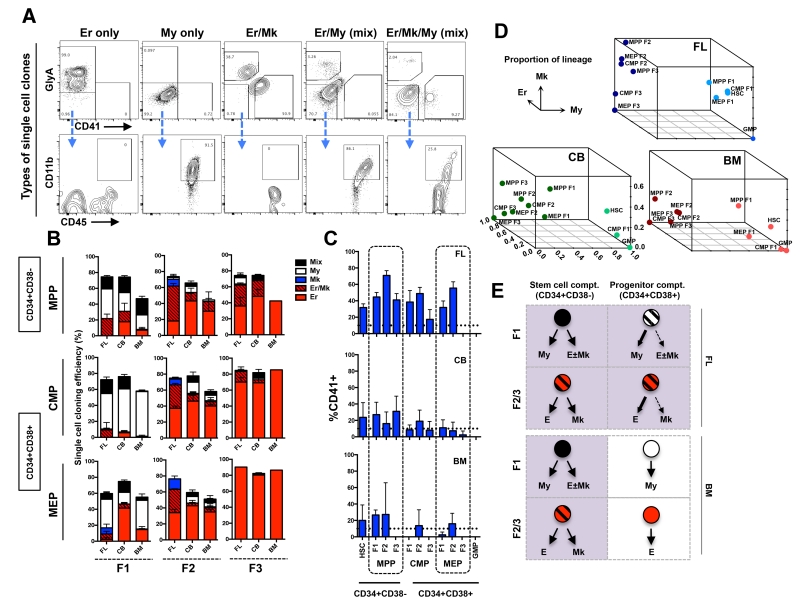
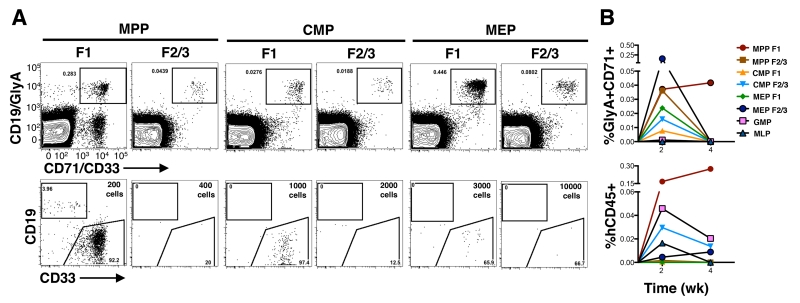
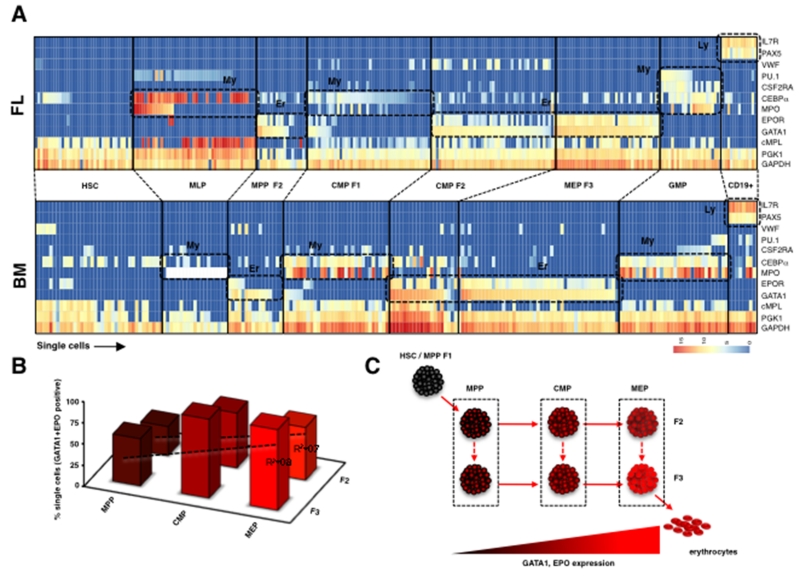
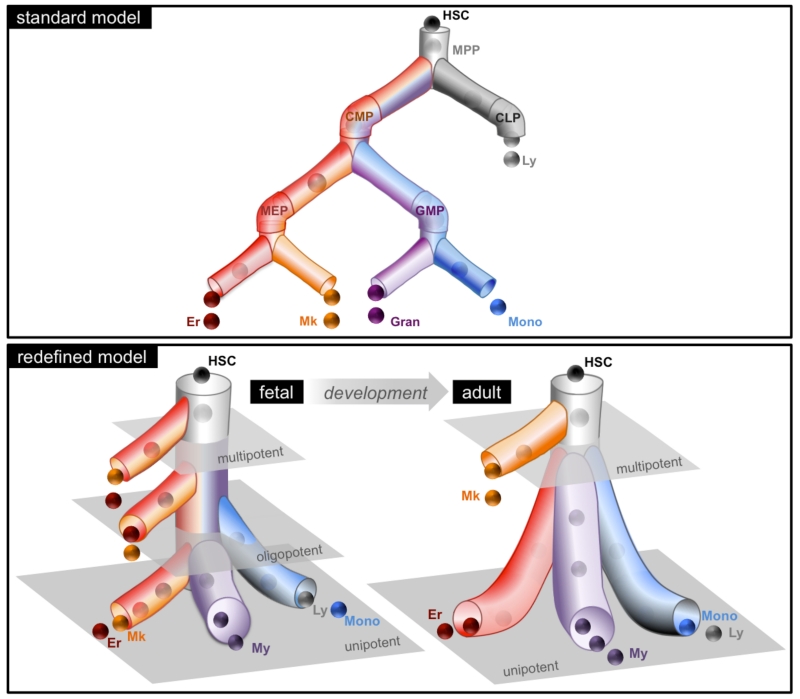
In a classical view of hematopoiesis, the various blood cell lineages arise via a hierarchical scheme starting with multipotent stem cells that become increasingly restricted in their differentiation potential through oligopotent and then unipotent progenitors. We developed a cell-sorting scheme to resolve myeloid (My), erythroid (Er), and megakaryocytic (Mk) fates from single CD34(+) cells and then mapped the progenitor hierarchy across human development. Fetal liver contained large numbers of distinct oligopotent progenitors with intermingled My, Er, and Mk fates. However, few oligopotent progenitor intermediates were present in the adult bone marrow. Instead, only two progenitor classes predominate, multipotent and unipotent, with Er-Mk lineages emerging from multipotent cells. The developmental shift to an adult "two-tier" hierarchy challenges current dogma and provides a revised framework to understand normal and disease states of human hematopoiesis.


Figures

Figure 1
Figure 1. Use of novel phenotypic markers revealed heterogeneity in human hematopoietic hierarchy
(A) A review of classic interpretations from previous work using CFC assays to measure the clonal outputs from a sorted, marker-pure population of cells. In scenario 1, each cell within a marker-pure population has the potential to give rise to three functional outputs (a, b, and c), but only gives rise to one of them in the assay. In this scenario, diverse functional outputs from a marker-pure population are interpreted to be derived from a pure population of a multilineage cells. In the alternate scenario 2, a marker pure population is comprised of three distinct unipotent cell types that give rise to their respective functional progeny. Solutions to each one of these scenarios are presented on the right. (B) The gating scheme of defining MPPs (CD34+CD38−Thy1−CD45RA−CD49f−), CMPs (CD34+CD38+CD10−FLT3+CD45RA−) and MEPs (CD34+CD38+CD10−FLT3CD45RA−) from FL is shown with black-dashed arrows. Each one of these compartments was further divided into F1 (CD71−BAH1−), F2 (CD71+BAH1−), and F3 (CD71+BAH1+) shown with blue-dashed arrows. Full gating scheme for FL, CB, and BM CD34+ cells is presented in fig. S1. (C) Summary of the new subsets used in this study.
Figure 2
Figure 2. Assessment of multilineage and unilineage cell potential of single CD34+ cells from FL, CB and BM
(A-D) Single cells from subsets shown in Fig. 1B and fig. S1 were deposited by FACS and cultured for several weeks. Emergent clones were analyzed by flow cytometry for My, Er and Mk lineages (Fig. 3A). To gain a global perspective of the functional differences, subsets were combined into one analysis of the CD34+ compartment (A&B), or stem (CD34+CD38−) and progenitor (CD34+CD38+) (C&D) compartments. Multilineage (black) potential was defined as any single cell that gave rise to more than one lineage (any two of My, E, Mk), and unipotent (white) potential as a single cell that gave rise to one lineage only (My or E or Mk) (B&D). Overall cloning efficiency is shown in grey (A&C). (E) Distribution of multilineage and unilineage cell potential from populations that lack expression of CD71 and BAH-1 (F1s) in FL, CB and BM. Shown by increasing levels of differentiation (HSC > MPP F1 > CMP F1 > MEP F1). Asterisks indicate significance based on Fisher’s exact test (* p<0.05, ** p<0.01, *** p<0.001, **** p<0.0001).
Figure 3
Figure 3. Lineage analysis of single cell derived clones from newly defined subsets of human MPPs, CMPs and MEPs
(A) Single cell clones were analyzed by flow cytometry and binned into 5 distinct lineage outcomes. Erythroid clones were defined as GlyA+ only (Er only). Myeloid clones were identified as GlyA−CD41−, but CD45+CD11b+ (My only). Erythroid-megakaryocyte clones were defined as GlyA+ and CD41+ but negative for CD11b (Er/Mk). Mix clones were defined as the My cells (CD45+CD11b+) and Er cells (GlyA+) or Mk (CD41+) (column 4), or both (column 5). (B) Cloning efficiency and lineage outcomes of single cells from newly defined MPP, CMP, and MEP fractions (F1s, F2s and F3s) from FL, CB and BM. (C) Total Mk output (CD41+) from all newly defined subsets from FL, CB and BM. Bars indicate mean ± standard error. Total number of independent experiments: n=3, 6 and 4 for FL, CB and BM respectively. (D) 3-D summary of lineage outputs (My, Er and Mk) from all cellular subsets in FL, CB and BM presented in Fig. 3B. (E) Pictorial summary of the predominant lineage outcomes from stem (CD34+CD38−) and progenitor (CD34+CD38+) cell compartments in FL and BM data.
Figure 4
Figure 4. In vivo potential of progenitor subsets
(A) Freshly sorted populations from CB were intrafemorally transplanted into sublethally irradiated NOD-scid-IL2Rgnull (NSG) mice. BM cells from injected femur and non-injected bones were analyzed by flow cytometry 2 weeks post transplant. Average transplanted cell dose is shown as an inset in the flow plot. Top row indicates Er engraftment (GlyA+CD71+). Bottom row depicts the CD45+ cells, B-lymphoid cells and My cells were detected using CD19 and CD33, respectively. (B) Kinetic analysis of engraftment from progenitor subsets. Mean levels of erythroid (GlyA+CD71+) and human cell engraftment (CD45+) are shown.
Figure 5
Figure 5. Single cell gene expression profiling from FL and BM subsets
(A) Single cells from FL (top) and BM (bottom) subsets were sorted and analyzed for expression of genes associated with My, Er, and lymphoid (Ly) lineages (shown on right) on the Fluidigm platform. My, Er or Ly gene clusters are shown as dashed boxes. (B) Percent of single cells that co-express GATA1 and EPOR in F2 and F3 from MPP, CMP, and MEP subsets. BM and FL F2 and F3 subsets were combined in this analysis. (C) A theoretical subnetwork of Er progenitors within the CD34+ compartment.
Figure 6
Figure 6. Analysis of My and Er progenitors in patients with aplastic anemia
(A) To examine the consequences of HSC loss on progenitor subsets, BM cells from three AA patients and normal controls were subjected to the new sorting design shown in Fig. 1B. Representative flow plots from a single AA case and a control are shown. (B) Quantification of total CD34+ cells as a fraction of mononuclear cell (MNC) pool from controls (empty bars) versus AA (filled bars). (C-D) The CD34+ subset from controls and AA was further sub-divided into the stem (CD34+CD38−) and progenitor (CD34+CD38+) cell compartments. (E) Analysis of My enriched subsets (CMP F1, MEP F1 and GMP) in control and patients with AA. (F) Analysis of Er enriched subsets (CMP F2/F3, MEP F2/F3) in controls and AA. Bars indicate mean ± standard error from 3 controls and 3 cases of AA. Asterisks indicate significance based on t-test (** p<0.01, **** p<0.0001).
Figure 7
Figure 7. Redefined model of human blood development
A graphical representation of the redefined model that encompasses the predominant lineage potential of the newly defined progenitor subsets; the standard model is shown for comparison. The redefined model envisions a developmental shift in the progenitor cell architecture resulting in a two-tier hierarchy by adulthood.

Comment in

References

    1. TILL JE, McCULLOCH EA. Hemopoietic stem cell differentiation. Biochim. Biophys. Acta. 1980;605:431–459. - PubMed
    1. Spangrude GJ, et al. Mouse hematopoietic stem cells. Blood. 1991;78:1395–1402. - PubMed
    1. Adolfsson J, et al. Identification of Flt3+ lympho-myeloid stem cells lacking erythro-megakaryocytic potential a revised road map for adult blood lineage commitment. 2005;121:295–306. - PubMed
    1. Månsson R, et al. Molecular Evidence for Hierarchical Transcriptional Lineage Priming in Fetal and Adult Stem Cells and Multipotent Progenitors. Immunity. 2007;26:407–419. - PubMed
    1. Yamamoto R, et al. Clonal Analysis Unveils Self-Renewing Lineage-Restricted Progenitors Generated Directly from Hematopoietic Stem Cells. 2013;154:1112–1126. - PubMed

Publication types

Associated data