. 2015 Dec 15;128(24):4601-14.
doi: 10.1242/jcs.175760. Epub 2015 Nov 5.

A direct interaction between fascin and microtubules contributes to adhesion dynamics and cell migration

Affiliations

A direct interaction between fascin and microtubules contributes to adhesion dynamics and cell migration

Giulia Villari et al. J Cell Sci. .

Abstract

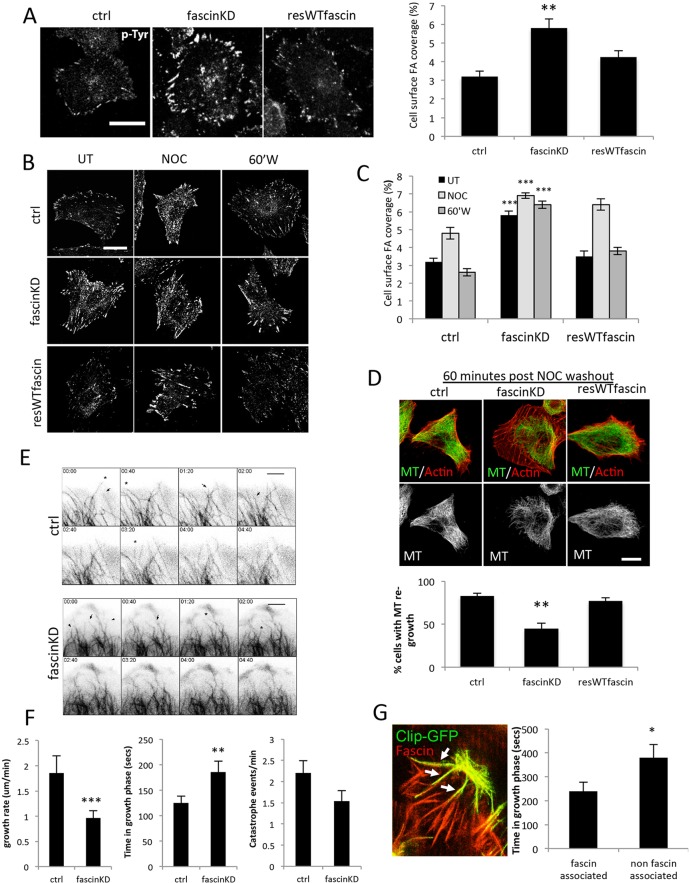
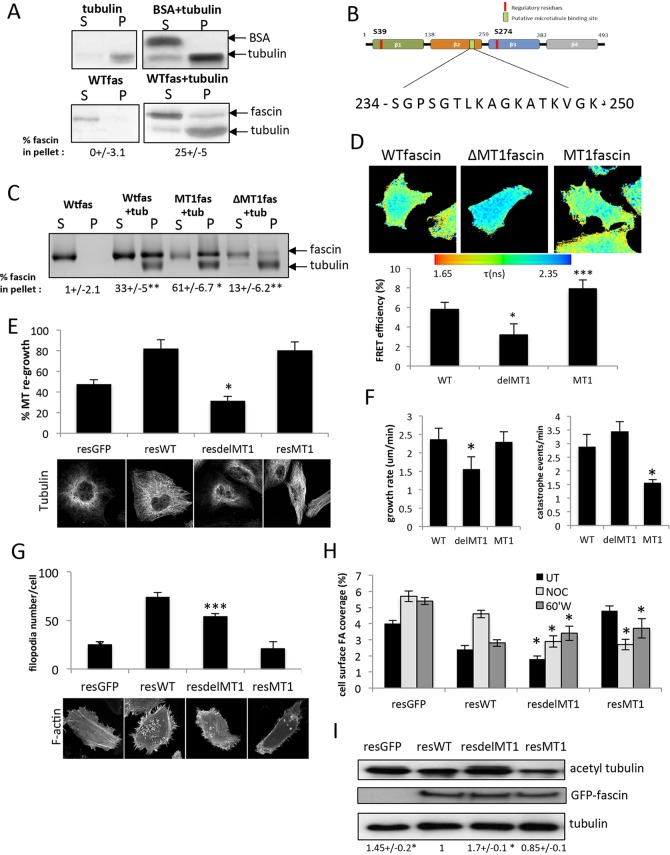
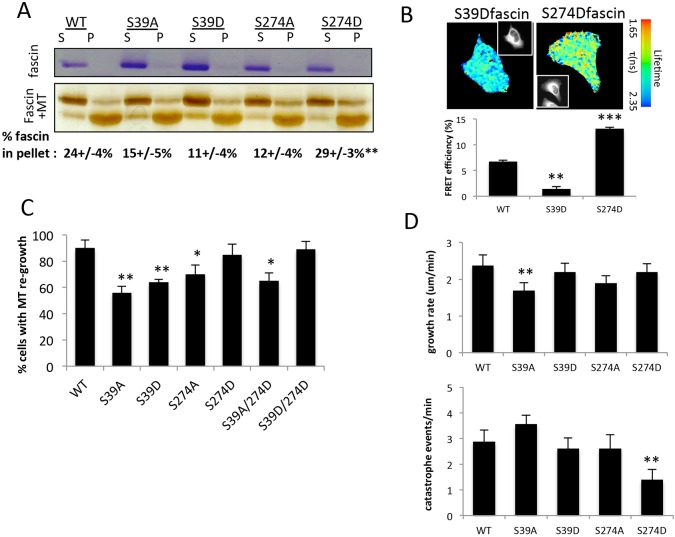
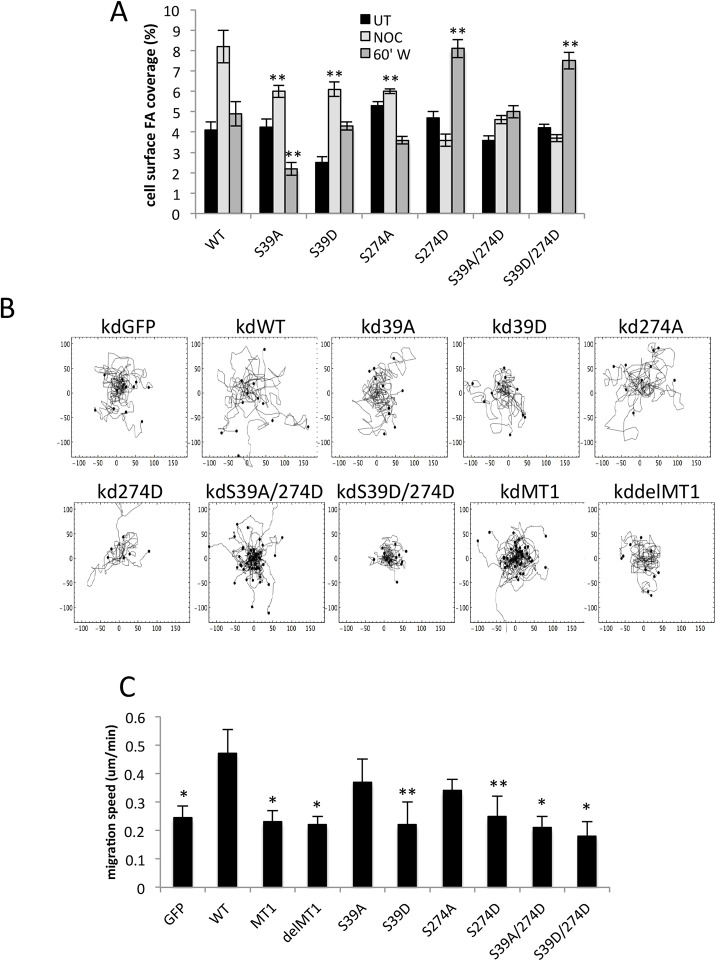
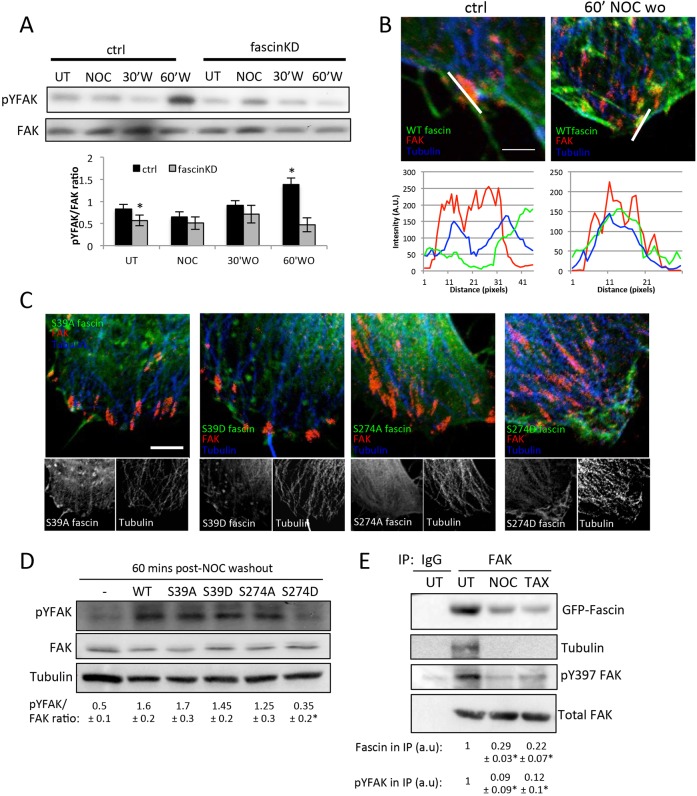
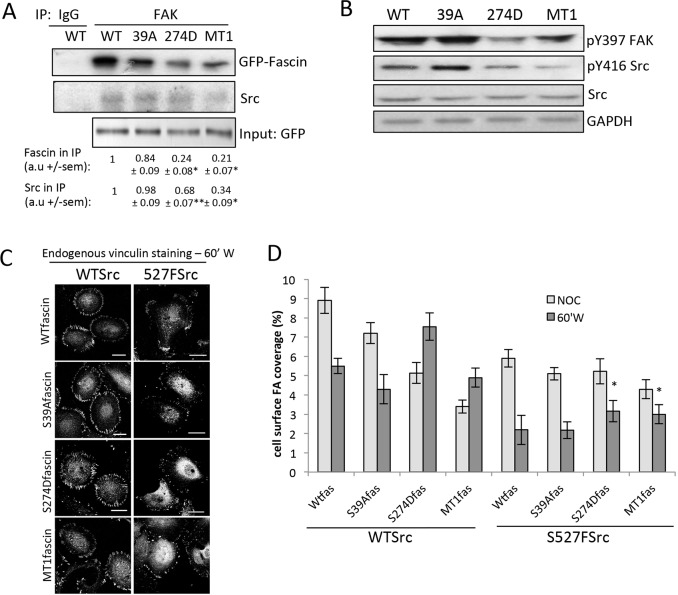
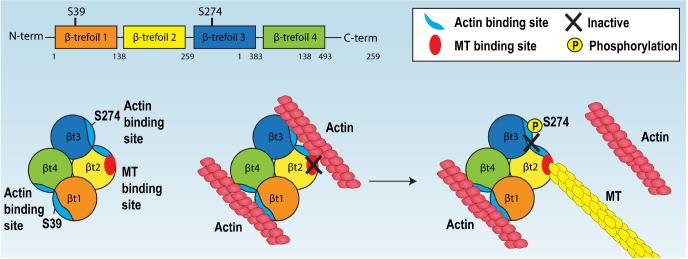
Fascin is an actin-binding and bundling protein that is highly upregulated in most epithelial cancers. Fascin promotes cell migration and adhesion dynamics in vitro and tumour cell metastasis in vivo. However, potential non-actin bundling roles for fascin remain unknown. Here, we show for the first time that fascin can directly interact with the microtubule cytoskeleton and that this does not depend upon fascin-actin bundling. Microtubule binding contributes to fascin-dependent control of focal adhesion dynamics and cell migration speed. We also show that fascin forms a complex with focal adhesion kinase (FAK, also known as PTK2) and Src, and that this signalling pathway lies downstream of fascin-microtubule association in the control of adhesion stability. These findings shed light on new non actin-dependent roles for fascin and might have implications for the design of therapies to target fascin in metastatic disease.

Keywords: Actin; Cytoskeleton; Fascin; Focal adhesion; Focal adhesion kinase; Microtubule; Migration.


Conflict of interest statement

Competing interests

The authors declare no competing or financial interests.

Figures

Fig. 1.
Fig. 1.
Fascin regulates focal adhesion size and MT dynamics. (A) Representative images of phosphotyrosine (p-Tyr)-stained MDA MB 231 cells expressing control (ctrl) shRNA, fascinKD shRNA or fascinKD shRNA and WT fascin–GFP (resWTfascin). Scale bar: 20 μm. The bar graph shows the mean±s.e.m. quantification of the percentage focal adhesion coverage area per cell calculated from 50 cells per condition over three independent experiments. (B) Representative images of MDA MB 231 cells as in A, that was either untreated (UT), treated with NOC for 20 min (NOC) or at 60 min post-NOC washout (60′W). Scale bar: 20 μm. (C) A bar graph representing the mean±s.e.m. quantification of the percentage of the cell surface covered by focal adhesions from images similar to those in B. n=40 cells per condition over three independent experiments. (D) Example images of control or fascinKD cells stained for F-actin (red) or tubulin (green) at 60 min after NOC washout. The graph below shows mean±s.e.m. values of MT re-growth from n=30 cells per experiment. Images are representative of findings across three independent experiments. (E) Example images taken from time-lapse confocal microscopy movies of control or fascinKD HeLa cells expressing tubulin–mCherry. Full movies are shown in Movie 1. Arrows and arrowheads denote growing or stable MTs, respectively. Asterisks denote catastrophe events. (F) Bar graphs showing mean±s.e.m. quantification of MT growth rate, time spent in growth phase and MT catastrophe events per minute calculated from 15 MTs per cell in six cells per experiment over four independent experiments. (G) Representative image of live Drosophila haemocytes within living embryos co-expressing mCherry–fascin and Clip–GFP. Arrows indicate regions of colocalisation between fascin and Clip. The graph shows quantification from movies of live Drosophila haemocytes within living embryos co-expressing mCherry–fascin and Clip–GFP. Growth of fascin-associated and non-associated MTs are shown. Values are pooled from 95 MTs analysed from eight cells across six independent movies. An example time-lapse is shown in Movie 2. Bars show mean±s.e.m. *P<0.05; **P<0.01; ***P<0.001 compared to controls (A,C,D, Students t-test; F,G, one-way ANOVA). Scale bars: 20 μm.
Fig. 2.
Fig. 2.
Fascin binds to MTs. (A) Example images of silver-stained gels showing levels of purified WT fascin (WTfas) and tubulin in the supernatant (S) or pellet (P) fractions following co-sedimentation. BSA was used as a protein control (top panel). Values beneath show the mean±s.e.m. percentage of fascin in the pellet from three independent experiments. (B) Schematic showing identified putative MT1 binding domain in fascin. (C) Co-sedimentation analysis of purified WT versus mutant fascins with tubulin (tub). MT1fas denotes mutated fascin, ΔMT1fas has a deleted MT1 domain. Values beneath show the mean±s.e.m. percentage of fascin in the pellet from four independent experiments. (D) Example fluorescence lifetime maps of fascinKD cells expressing GFP-tagged WT, ΔMT1- or MT1-fascin and tubulin–mCherry. A pseudocolour lifetime scale is shown where warmer colours denote low lifetimes and therefore high FRET. The graph beneath shows quantification of FRET efficiency for each condition from 18 cells per condition over three independent experiments. Mean±s.e.m. values are shown. (E) Quantification of MT re-growth in HeLa fascinKD cells re-expressing GFP only (resGFP) or GFP-tagged WT, ΔMT1- or MT1-fascin (resWT, resdelMT1 and resMT1, respectively) at 60 min after NOC washout. Fixed cells stained with anti-tubulin antibodies were scored as in Fig. 1. Example images are shown below the graph. (F) Analysis of MT growth rate (left graph) and catastrophe events/min (right graph) in fascinKD HeLa cells re-expressing GFP-tagged WT, ΔMT1- or MT1-fascin. Mean±s.e.m. are calculated from 25 MTs per cell in five cells per experiment and three independent experiments. Example movies are shown in Movie 3. (G) Quantification of filopodia number/cell in MDA MB 231 fascinKD cells re-expressing GFP alone, or GFP-tagged WTfascin or the MT1 or ΔMT1 mutants. Example images are shown below the graph. (H) Quantification of the percentage focal adhesion surface area coverage in FascinKD cells expressing WT or MT1 mutant GFP–fascin that were either untreated (UT), treated with NOC for 20 min (NOC) or at 60 min post-NOC washout (60′W). n≥35 cells quantified across three independent experiments. Mean values±s.e.m. are shown. (I) Western blots of acetylated tubulin in HeLa fascin knockdown cells expressing GFP or the specified fascin mutants. Blots were re-probed for GFP and tubulin. Numbers below blots are means±s.e.m. from three experiments. *P<0.05; **P<0.01; ***P<0.001 compared to controls (one-way ANOVA).
Fig. 3.
Fig. 3.
Phosphorylation of fascin regulates MT and adhesion dynamics. (A) Example images of Coomassie and silver-stained gels from co-sedimentation analysis of purified WT versus mutant fascin alone (top gel) or with tubulin (bottom gel) in the supernatant (S) or pellet (P) fractions. Values beneath show the mean±s.e.m. percentage of fascin in the pellet from three independent experiments. (B) Example fluorescence lifetime maps of fascinKD cells expressing S39D- or S274D-fascin–GFP and tubulin–mCherry (shown in inset panels). A pseudocolour lifetime scale is shown next to each image. Graph shows quantification of FRET efficiency for WT, S39D- and S274D-fascin-expressing cells from 15 cells per condition over two independent experiments. Mean±s.e.m. values are shown. (C) Quantification of MT re-growth from images of fixed MDA MB 231 FascinKD cells expressing WT or mutant GFP–fascin at 60 min post-NOC washout. n=30 cells were quantified across three independent experiments. (D) Analysis of MT growth rate (left graph) and catastrophe events/min (right graph) in fascinKD HeLa cells re-expressing WT or mutant GFP–fascin variants as specified. Values are calculated from 25 MT per cell in five cells per experiment over three independent experiments. Example movies are shown in Movie 4. *P<0.05; **P<0.01; ***P<0.001 compared to controls (one-way ANOVA).
Fig. 4.
Fig. 4.
Fascin–MT binding regulates cell adhesion dynamics and migration. (A) Quantification of focal adhesion surface area coverage of MDA MB 231 FascinKD cells expressing WT or mutant GFP–fascin that were either untreated (UT), treated with NOC for 20 min (NOC) or at 60 min post-NOC washout (60′W). n=45 cells were quantified across three independent experiments. (B) Example migration tracks of MDA MB 231 FascinKD cells expressing WT or mutant GFP–fascin taken from time-lapse movies. (C) Quantification of migration speed as determined from tracks as shown in C. n=60 cells per condition. Mean±s.e.m. values are shown. *P<0.05; **P<0.01 compared to controls (one-way ANOVA).
Fig. 5.
Fig. 5.
Fascin regulates activation of FAK. (A) Lysates from control (ctrl) and fascinKD MDA MB 231 cells that were either untreated (UT), treated with NOC for 20 min (NOC) or at 30 or 60 min post-NOC washout were subjected to western blot analysis for pY397-FAK (pYFAK) or total FAK. The graph beneath the blots shows densitometry quantification of pY397-FAK/total FAK levels from three independent experiments. Mean±s.e.m. values are shown. (B) Representative confocal images of regions of control MDA MB 231 cells that were untreated (UT) or following NOC washout (60′W) fixed and stained for endogenous fascin (green), FAK (red) and tubulin (blue). Merged images are shown. Scale bar: 2 μm. A profile of staining along the indicated line is shown underneath the images. (C) Example images of FAK staining (red) at focal adhesions at the periphery of fascinKD MDA MB 231 cells expressing the specified fascin–GFP constructs (green) co-stained for tubulin (blue). Merged images are shown in top panels, and fascin and tubulin channels are shown as black-and-white images below. Scale bar: 15 μm. (D) Western blot of lysates from fascinKD or the specified GFP–fascin rescued MDA MB 231 cells at 60 min post-NOC washout, probed for pYFAK, FAK or tubulin. Numbers beneath blots are a mean±s.e.m. densitometry quantification of pY397-FAK/total FAK levels from three independent experiments. (E) Western blots of lysates from control cells treated with NOC or Taxol and immunoprecipitated (IP) with control (IgG) or anti-FAK antibodies. Blots were probed for specified proteins. Relative fascin and pY397-FAK levels in each immunoprecipitation lane were quantified over four independent experiments (mean±s.e.m. densitometry values are denoted below each respective lane). *P<0.01 compared to control (A,D); *P<0.001 compared to untreated controls (E) (A,D, one-way ANOVA; E, Student's t-test).
Fig. 6.
Fig. 6.
Microtubule-dependent adhesion dynamics are regulated through a fascin–FAK–Src signalling pathway. (A) Western blots of lysates from fascinKD cells expressing WT, S39A-, S274D- or MT1-fascin–GFP immunoprecipitated (IP) with control (IgG) or anti-FAK antibodies. Blots of immunoprecipitations (left panel) were re-probed for specified proteins. Values are denoted below each respective lane and represent relative intensity of each band as a mean±s.e.m. of the four experiments. (B) Western blots of lysates from fascinKD cells expressing GFP-tagged WT, S39A-, S274D- or MT1-fascin probed with the specified antibodies. (C) Representative images of vinculin staining in fascinKD HeLa cells expressing GFP-tagged WT Src (WTSrc) or constitutively active S527F Src (527FSrc) with WT, S39A or 274D-fascin–mFP at 60 min post-NOC washout. Scale bars: 20 μm. (D) The percentage focal adhesion coverage per cell was quantified from cells treated with NOC for 20 min (NOC) or at 60 min following NOC washout (60′W). n=45 cells were quantified across three independent experiments. Mean values±s.e.m. are shown. *P<0.05, **P<0.01, compared to untreated controls (A); *P<0.01 compared to WT fascin (D) (one-way ANOVA).
Fig. 7.
Fig. 7.
Proposed model of fascin cytoskeletal associations. Model for fascin-dependent association with F-actin or MTs. See Discussion for details.

Similar articles

Cited by

References

    1. Anilkumar N., Parsons M., Monk R., Ng T. and Adams J. C. (2003). Interaction of fascin and protein kinase Calpha: a novel intersection in cell adhesion and motility. EMBO J. 22, 5390-5402. 10.1093/emboj/cdg521 - DOI - PMC - PubMed
    1. Bi J., Chen X., Zhang Y., Li B., Sun J., Shen H. and Kong C. (2012). Fascin is a predictor for invasiveness and recurrence of urothelial carcinoma of bladder. Urol. Oncol. 30, 688-694. 10.1016/j.urolonc.2010.08.001 - DOI - PubMed
    1. Byron A., Askari J. A., Humphries J. D., Jacquemet G., Koper E. J., Warwood S., Choi C. K., Stroud M. J., Chen C. S., Knight D. et al. (2015). A proteomic approach reveals integrin activation state-dependent control of microtubule cortical targeting. Nat. Commun. 6, 6135 10.1038/ncomms7135 - DOI - PMC - PubMed
    1. Cao B. and Mao C. (2009). Identification of microtubule-binding domains on microtubule-associated proteins by major coat phage display technique. Biomacromolecules 10, 555-564. 10.1021/bm801224q - DOI - PubMed
    1. Chang Y.-C., Nalbant P., Birkenfeld J., Chang Z.-F. and Bokoch G. M. (2008). GEF-H1 couples nocodazole-induced microtubule disassembly to cell contractility via RhoA. Mol. Biol. Cell 19, 2147-2153. 10.1091/mbc.E07-12-1269 - DOI - PMC - PubMed

Publication types

MeSH terms

LinkOut - more resources