

Nitric Oxide Regulates Gene Expression in Cancers by Controlling Histone Posttranslational Modifications
- PMID: 26542213
- PMCID: PMC4681644
- DOI: 10.1158/0008-5472.CAN-15-1582
Nitric Oxide Regulates Gene Expression in Cancers by Controlling Histone Posttranslational Modifications
Abstract
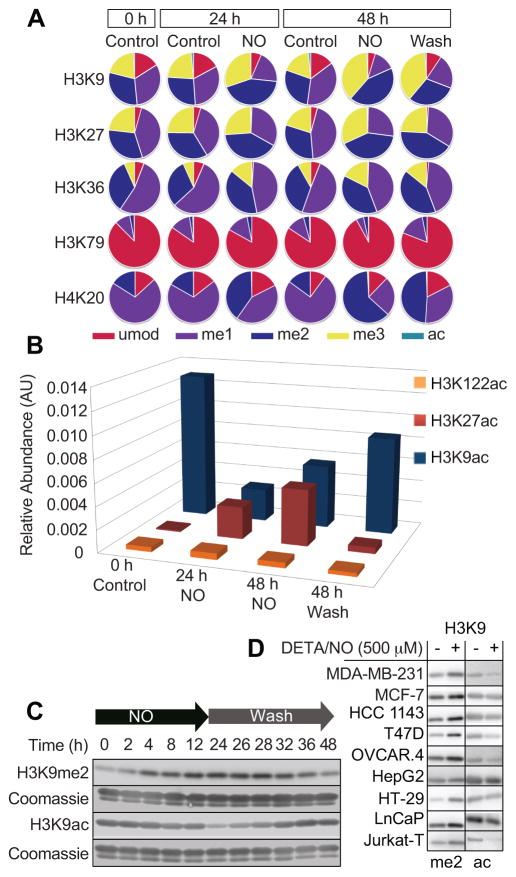
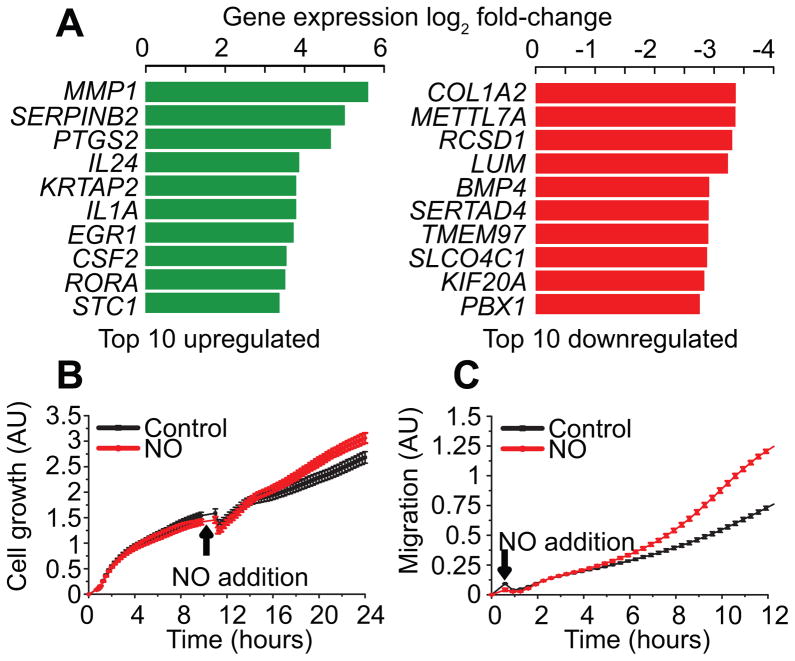
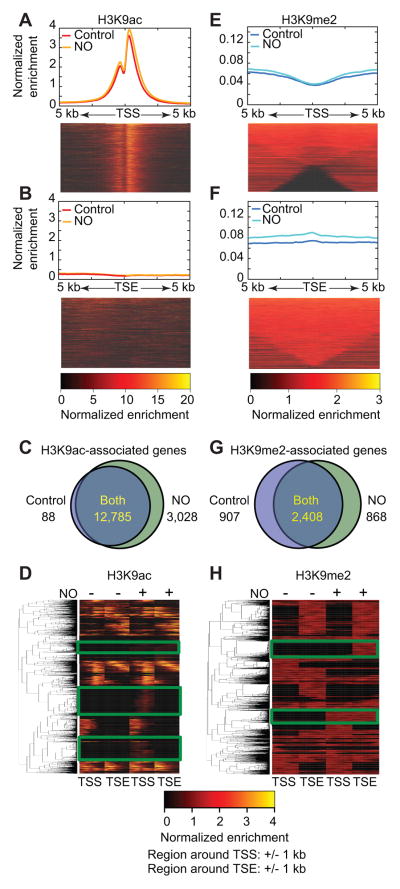
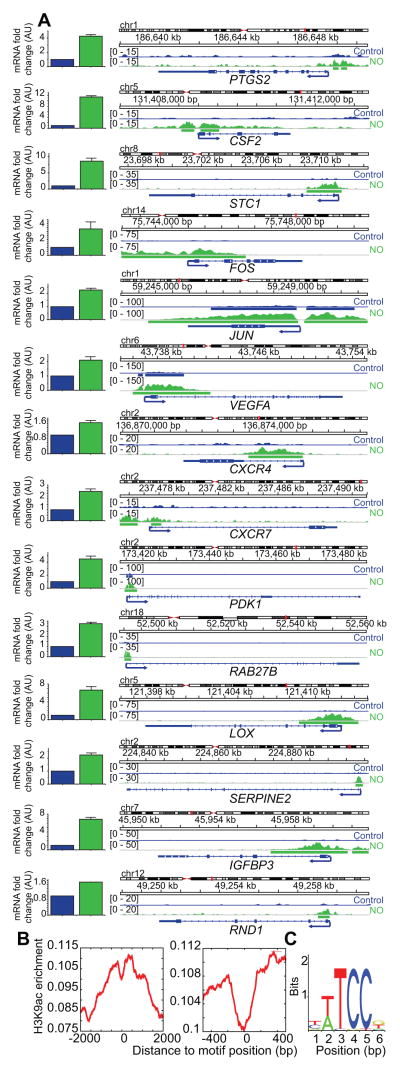
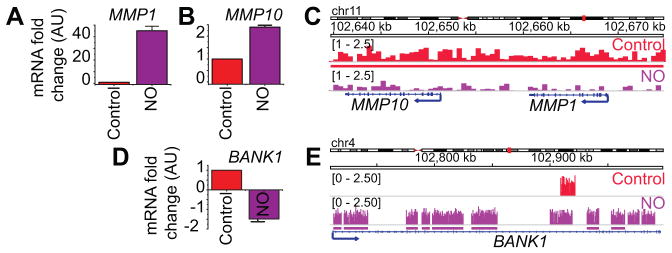
Altered nitric oxide (•NO) metabolism underlies cancer pathology, but mechanisms explaining many •NO-associated phenotypes remain unclear. We have found that cellular exposure to •NO changes histone posttranslational modifications (PTM) by directly inhibiting the catalytic activity of JmjC-domain containing histone demethylases. Herein, we describe how •NO exposure links modulation of histone PTMs to gene expression changes that promote oncogenesis. Through high-resolution mass spectrometry, we generated an extensive map of •NO-mediated histone PTM changes at 15 critical lysine residues on the core histones H3 and H4. Concomitant microarray analysis demonstrated that exposure to physiologic •NO resulted in the differential expression of over 6,500 genes in breast cancer cells. Measurements of the association of H3K9me2 and H3K9ac across genomic loci revealed that differential distribution of these particular PTMs correlated with changes in the level of expression of numerous oncogenes, consistent with epigenetic code. Our results establish that •NO functions as an epigenetic regulator of gene expression mediated by changes in histone PTMs.
©2015 American Association for Cancer Research.
Conflict of interest statement
Figures
Similar articles
-
SILAC-based proteomic analysis to dissect the "histone modification signature" of human breast cancer cells.Amino Acids. 2011 Jul;41(2):387-99. doi: 10.1007/s00726-010-0668-2. Epub 2010 Jul 9. Amino Acids. 2011. PMID: 20617350
-
Epigenetics: The third pillar of nitric oxide signaling.Pharmacol Res. 2017 Jul;121:52-58. doi: 10.1016/j.phrs.2017.04.011. Epub 2017 Apr 17. Pharmacol Res. 2017. PMID: 28428114 Review.
-
Analysis of Histones H3 and H4 Reveals Novel and Conserved Post-Translational Modifications in Sugarcane.PLoS One. 2015 Jul 30;10(7):e0134586. doi: 10.1371/journal.pone.0134586. eCollection 2015. PLoS One. 2015. PMID: 26226299 Free PMC article.
-
Regulation of chromatin structure via histone post-translational modification and the link to carcinogenesis.Cancer Metastasis Rev. 2013 Dec;32(3-4):363-76. doi: 10.1007/s10555-013-9434-8. Cancer Metastasis Rev. 2013. PMID: 23609752 Review.
-
Comprehensive structural analysis of mutant nucleosomes containing lysine to glutamine (KQ) substitutions in the H3 and H4 histone-fold domains.Biochemistry. 2011 Sep 13;50(36):7822-32. doi: 10.1021/bi201021h. Epub 2011 Aug 17. Biochemistry. 2011. PMID: 21812398
Cited by
-
The role of gasotransmitters in neonatal physiology.Nitric Oxide. 2020 Feb 1;95:29-44. doi: 10.1016/j.niox.2019.12.002. Epub 2019 Dec 20. Nitric Oxide. 2020. PMID: 31870965 Free PMC article. Review.
-
Early Programming of Adult Systemic Essential Hypertension.Int J Mol Sci. 2020 Feb 11;21(4):1203. doi: 10.3390/ijms21041203. Int J Mol Sci. 2020. PMID: 32054074 Free PMC article. Review.
-
Pillars and Gaps of S-Nitrosylation-Dependent Epigenetic Regulation in Physiology and Cancer.Life (Basel). 2021 Dec 17;11(12):1424. doi: 10.3390/life11121424. Life (Basel). 2021. PMID: 34947954 Free PMC article. Review.
-
Nitric Oxide: The Forgotten Child of Tumor Metabolism.Trends Cancer. 2017 Sep;3(9):659-672. doi: 10.1016/j.trecan.2017.07.005. Epub 2017 Aug 18. Trends Cancer. 2017. PMID: 28867169 Free PMC article. Review.
-
Redox biology and the interface between bioenergetics, autophagy and circadian control of metabolism.Free Radic Biol Med. 2016 Nov;100:94-107. doi: 10.1016/j.freeradbiomed.2016.05.022. Epub 2016 May 27. Free Radic Biol Med. 2016. PMID: 27242268 Free PMC article. Review.
References
Publication types
MeSH terms
Substances
Grants and funding
LinkOut - more resources
Full Text Sources
Molecular Biology Databases
Miscellaneous
