

Intra-arterial transplantation of HLA-matched donor mesoangioblasts in Duchenne muscular dystrophy
- PMID: 26543057
- PMCID: PMC4693504
- DOI: 10.15252/emmm.201505636
Intra-arterial transplantation of HLA-matched donor mesoangioblasts in Duchenne muscular dystrophy
Erratum in
-
Intra-arterial transplantation of HLA-matched donor mesoangioblasts in Duchenne muscular dystrophy.EMBO Mol Med. 2016 Dec 1;8(12):1470-1471. doi: 10.15252/emmm.201607129. EMBO Mol Med. 2016. PMID: 27908983 Free PMC article.
Abstract
Intra-arterial transplantation of mesoangioblasts proved safe and partially efficacious in preclinical models of muscular dystrophy. We now report the first-in-human, exploratory, non-randomized open-label phase I-IIa clinical trial of intra-arterial HLA-matched donor cell transplantation in 5 Duchenne patients. We administered escalating doses of donor-derived mesoangioblasts in limb arteries under immunosuppressive therapy (tacrolimus). Four consecutive infusions were performed at 2-month intervals, preceded and followed by clinical, laboratory, and muscular MRI analyses. Two months after the last infusion, a muscle biopsy was performed. Safety was the primary endpoint. The study was relatively safe: One patient developed a thalamic stroke with no clinical consequences and whose correlation with mesoangioblast infusion remained unclear. MRI documented the progression of the disease in 4/5 patients. Functional measures were transiently stabilized in 2/3 ambulant patients, but no functional improvements were observed. Low level of donor DNA was detected in muscle biopsies of 4/5 patients and donor-derived dystrophin in 1. Intra-arterial transplantation of donor mesoangioblasts in human proved to be feasible and relatively safe. Future implementation of the protocol, together with a younger age of patients, will be needed to approach efficacy.
Keywords: Duchenne; MRI; cell therapy; dystrophin; mesoangioblast.
© 2015 The Authors. Published under the terms of the CC BY 4.0 license.
Figures
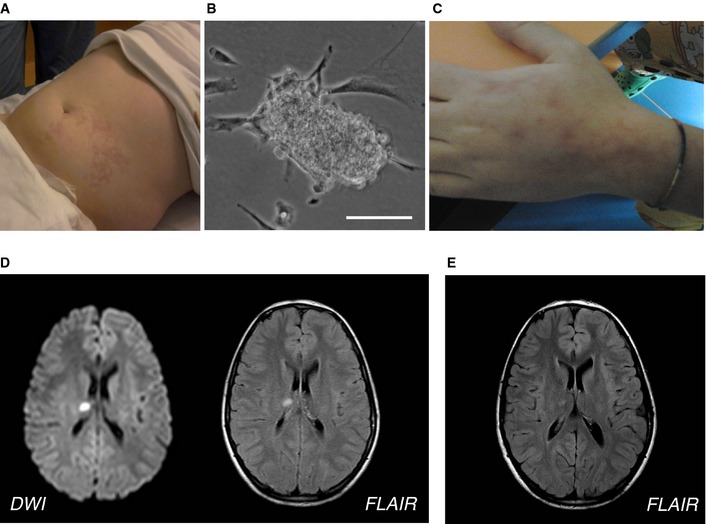
Livedo reticularis in the left abdominal lower quadrant after the first infusion in Pt 01.
Small clump of MABs observed in the first preparation of MP before the infusion of Pt 01. Scale bar, 30 μm.
Livedo reticularis in the left hand of Pt 02 after the first infusion.
Brain MRI acquired 1 day after the MAB infusion showing acute small thalamic stroke in Pt 03. Axial diffusion‐weighted imaging (left) and fluid‐attenuated inversion recovery (FLAIR; right) images show a focal spot of hyperintensity within the right thalamus consistent with acute stroke.
FLAIR MRI axial image obtained in Pt 03 1 month after the acute stroke, showing the expected evolution of the right thalamic lesion.
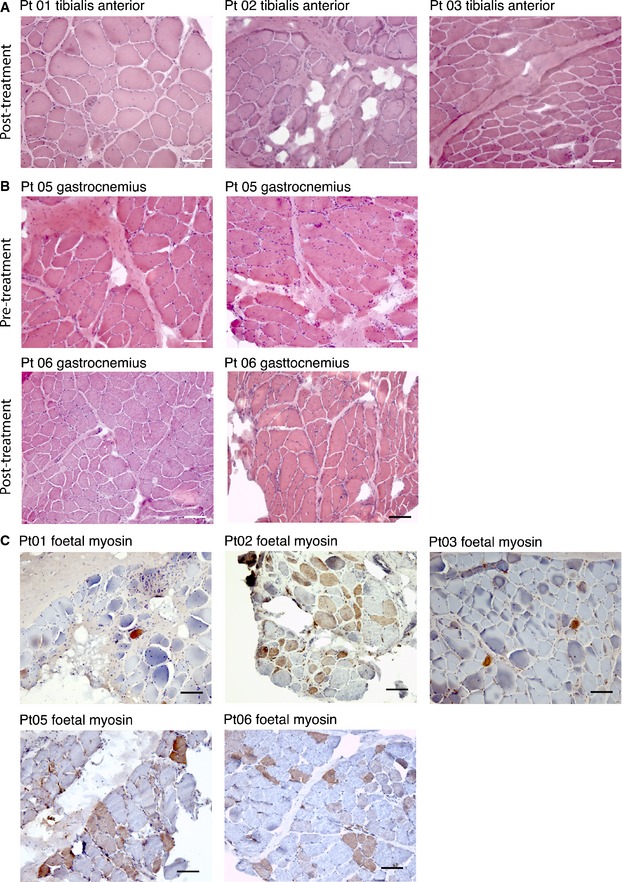
Hematoxylin and eosin staining of muscle biopsies from Pt 01, Pt 02, and Pt 03 performed 2 months after the last MAB infusion. Images show diffuse increase of connective tissue, atrophic and hypertrophic fibers, degenerating fibers, and diffuse centralization of nuclei. Scale bar, 100 μm.
Hematoxylin and eosin staining of muscle biopsies from Pt 05 and Pt 06 performed 1 month before the first MAB infusion and 2 months after the last MAB infusion. Images show diffuse increase of connective tissue, atrophic and hypertrophic fibers, degenerating fibers, and diffuse centralization of nuclei. No evident differences were observed between biopsy performed after and before treatment. Scale bar, 100 μm.
Immunohistochemistry showing fetal myosin expression in muscle biopsy of DMD patients performed 2 months after the last MAB infusion. The staining was performed in tibialis anterior muscle for Pt 01, Pt 02, and Pt 03 and in gastrocnemius muscle for Pt 05 and Pt 06. A higher number of positive (brownish staining) fibers (representing regenerating fibers) were observed in Pt 02, Pt 05, and Pt 06. Scale bar, 100 μm.
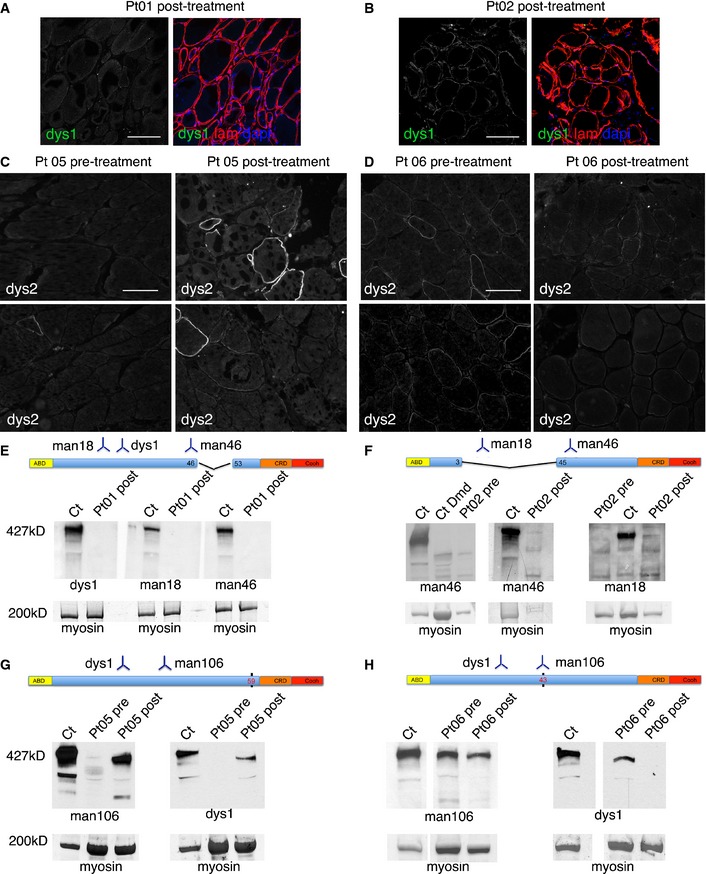
Confocal immunofluorescence of muscle biopsy from Pt 01 (tibialis anterior post‐treatment) stained with anti‐dystrophin dys1 antibody (which recognizes protein fragment encoded by exons 26–30, green signal) and anti‐laminin‐2 (to delineate muscle fibers, red signal); DAPI identifies nuclei (blue signal). In the left image, only anti‐dystrophin staining is shown. No dystrophin‐positive fibers were observed. Scale bar, 100 μm.
Confocal immunofluorescence of muscle biopsy from Pt 02 (tibialis anterior post‐treatment) stained with anti‐dystrophin dys1 antibody (green signal) and anti‐laminin‐2 (red signal); DAPI identifies nuclei (blue signal). In the left image, only anti‐dystrophin staining is shown. Some fiber shows mild and discontinuous dystrophin staining. Scale bar, 100 μm.
Immunofluorescence of muscle biopsy from Pt 05 taken before (left, gastrocnemius) and after treatment (right, gastrocnemius) stained with anti‐dystrophin dys2 antibody (which recognizes exons 77–79). The number and intensity of dystrophin‐positive fibers is increased in the post‐treatment biopsy. Scale bar, 80 μm.
Immunofluorescence of muscle biopsy from Pt 06 taken before (left, gastrocnemius) and after treatment (right, gastrocnemius) stained with anti‐dystrophin dys2 antibody. Few fibers show scattered dystrophin staining, without obvious differences between pre‐ and post‐treatment samples. Scale bar, 80 μm.
Results of Western blot analysis involving dystrophin antibodies dys1, Mandys18, and Manex46e (recognizing respectively exons 26–30, 17–35, and 46), of total protein extracts (20 μg) obtained from post‐treatment biopsy specimens of Pt 01 (tibialis anterior muscle); Ct was used as a positive dystrophin control. Below, bands corresponding to myosin heavy chain are shown as a loading control. No bands corresponding to full‐length dystrophin were observed. A schematic representation of the deleted portion of the dystrophin and the region recognized by the used antibodies is depicted above the Western blot.
Results of Western blot analysis, involving dystrophin antibodies Mandys18 and Manex46e, of total protein extracts (10–20 μg) obtained from pre‐treatment (performed at time of diagnosis) and post‐treatment biopsy specimens of Pt 02 (tibialis anterior muscle); Ct was used as a positive dystrophin control, CtDmd was used as a dystrophin‐negative control. Below, bands corresponding to myosin heavy chain are shown as a loading control. One faint band corresponding to full‐length dystrophin is observed only in the post‐treatment samples with both Mandys18 and Manex46e antibodies. A schematic representation of the deleted portion of the dystrophin and the region recognized by used antibodies is depicted above the Western blot.
Results of Western blot analysis, involving dystrophin antibodies Mandys106 (recognizing exon 43) and dys1, of total protein extracts (80 μg, following protein concentration by Amicon Ultra‐0.5 centrifugal filter devices; Millipore) obtained from pre‐treatment and post‐treatment biopsy specimens of Pt 05 (gastrocnemius); Ct was used as a positive dystrophin control. Below, bands corresponding to myosin heavy chain are shown as a loading control. Bands corresponding approximately to full‐length dystrophin are observed in pre‐ and post‐treatment samples with both antibodies. However, bands in post‐treatment sample appeared higher in amount. A schematic representation of the dystrophin point mutation (black vertical bar) and the region recognized by the used antibodies is depicted above the Western blot.
Results of Western blot analysis, involving dystrophin antibodies Mandys106 and dys1, of total protein extracts (80 μg, following protein concentration by Amicon Ultra‐0.5 centrifugal filter devices, Millipore) obtained from pre‐treatment and post‐treatment biopsy specimens of Pt 06 (gastrocnemius); Ct was used as a positive dystrophin control. Below, bands corresponding to myosin heavy chain are shown as a loading control. Bands corresponding approximately to full‐length dystrophin are observed in pre‐ and post‐treatment samples with both antibodies. Bands in pre‐treatment sample appeared higher in amount as compared to post‐treatment sample. A schematic representation of the dystrophin point mutation (black vertical bar) and the region recognized by the used antibodies is depicted above the Western blot.
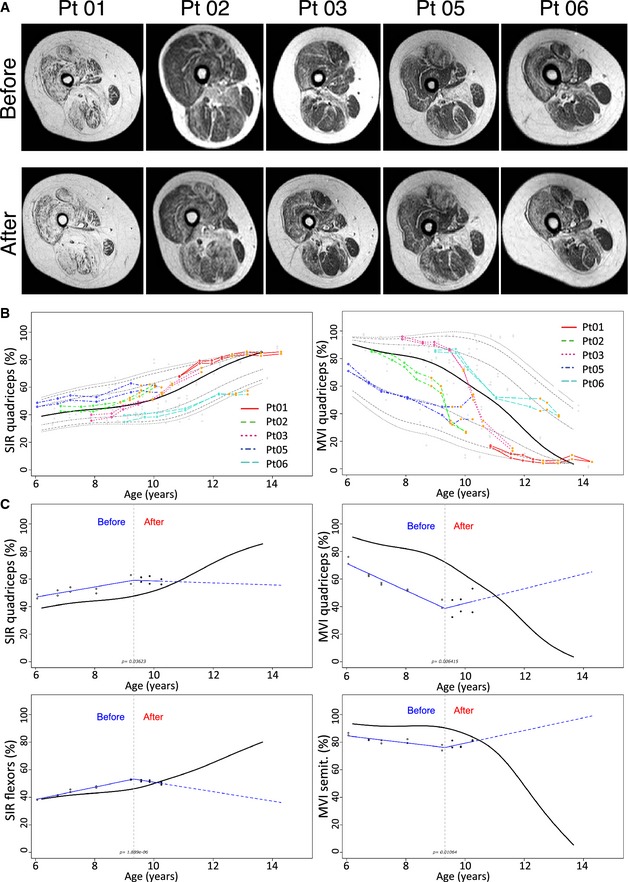
Axial T1‐weighted images of the right thighs obtained in patients immediately before (upper panel) and 18 months after MAB infusion. Please note the progression of fatty degeneration and atrophy except for Pt 05 where no evident modifications can be detected.
Representative percentile of MRI quantitative parameters in transplanted patients compared to untreated patients. SIR (left image) and MVI (right image) of the quadriceps. Red line: Pt 01; dotted green line: Pt 02; dotted purple line: Pt 03; dotted dark blue line: Pt 05; dotted light blue line: Pt 06). Empty dots correspond to pre‐treatment measures. Orange dots correspond to post‐transplantation measurement. The black line corresponds to the median, while gray dotted lines to 75th, 90th, and 95th percentile. Please note the modification of the trend of Pt 05 after treatment.
Representative quantile spline regressions of post‐transplant trend amelioration of MRI quantitative parameters in Pt 05. Upper left: SIR of the quadriceps. Lower left: SIR of thigh flexor muscles. Upper right: MVI of the quadriceps. Lower right: MVI of the semitendinosus muscles. Please note the significant modification of the patient trend (red lines) compared to median measurements obtained with 85 MRI examinations of untreated patients. Empty dots correspond to pre‐treatment measures. Full dots correspond to post‐transplantation measurement. The gray dotted line corresponds to the time of the first intra‐arterial transplantation.
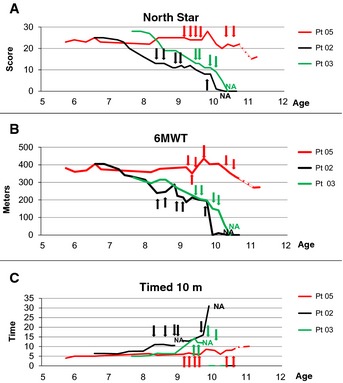
North Star scale measurement (NSAA score) plotted against age of ambulant DMD patients before, throughout and after MAB clinical trial. Arrows indicate time points of MAB infusion. Dotted line indicates the time period in which Pt 05 spontaneously suspended steroids treatment without communication to parents and clinicians. Pt 02 and Pt 05 showed score stabilization throughout 8 months of MAB infusions; Pt 05 showed stabilization even in the subsequent period, whereas Pt 02 showed progressive deterioration until loss of ambulation. Pt 03 showed progressive deterioration throughout MAB infusion and lost ambulation soon after the end of the trial.
6‐min walking test (meters) plotted against age of ambulant DMD patients before, throughout and after MAB clinical trial. Arrows indicate time points of MAB infusion. Dotted line indicates the time period in which Pt 05 spontaneously suspended steroids treatment without communication to parents and clinicians. Pt 02 and Pt 05 showed score stabilization throughout 8 months of MAB infusions; Pt 05 showed stabilization even in the subsequent period, whereas Pt 02 showed progressive deterioration until loss of ambulation. Pt 03 showed progressive deterioration throughout MAB infusion and lost ambulation soon after the end of the trial.
Time to run 10 m (time) plotted against age of ambulant DMD patients before, throughout and after MAB clinical trial. Arrows indicate time points of MAB infusion. Dotted line indicates the time period in which Pt 05 spontaneously suspended steroids treatment without communication to parents and clinicians. Pt 02 and Pt 05 showed time stabilization throughout 8 months of MAB infusions; Pt 05 showed stabilization even in the subsequent period, whereas Pt 02 showed progressive increase of time until loss of ambulation. Pt 03 showed progressive increase of time throughout MAB infusion and lost ambulation soon after the end of the trial.
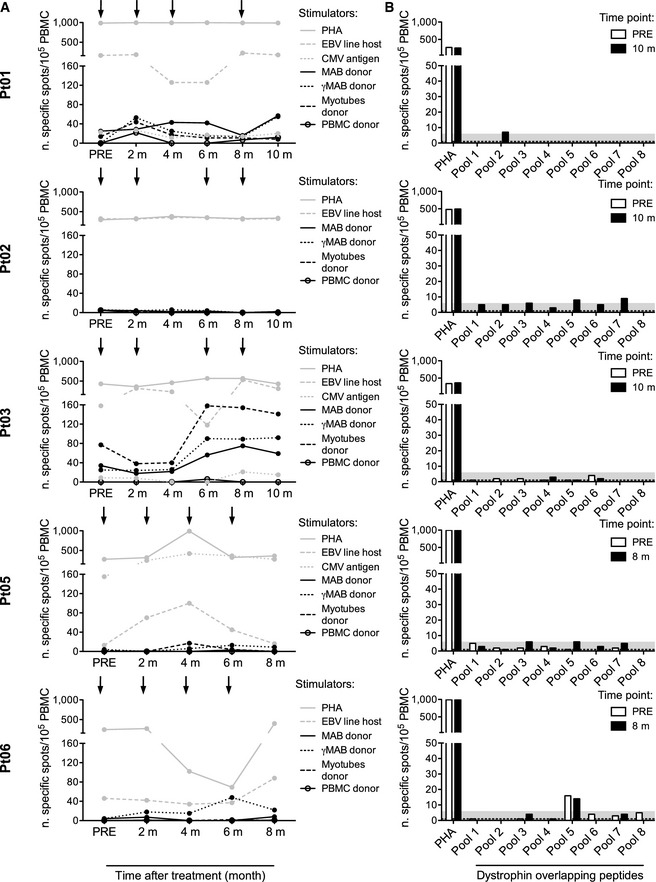
Viral and donor‐specific T‐cell responses were measured by IFN‐γ ELISpot at different time points: before the beginning of treatment (PRE), prior to each infusion, and 2 months after the fourth infusion. Infusions are indicated by arrows. Patient's peripheral blood mononuclear cells (PBMC) were challenged with irradiated autologous lymphoblastoid cell lines (EBV line host), with cytomegalovirus glycine extract (CMV antigen) (Gehrz et al, 1987) and with the following irradiated cells harvested from the donor: untreated mesoangioblasts (MAB donor), MAB activated by 48‐h exposure to 500 IU/ml IFN‐γ (γMAB donor), myotubes differentiated from MAB (myotubes donor) and PBMC (PBMC donor). Polyclonal stimulation (phytohemagglutinin, PHA) was used as a positive control. Donor PBMC were challenged with autologous targets as negative controls. Results are expressed as number of specific cells/105 PBMC and calculated according to the following formula: number of spots produced by patient's PBMC – number of spots produced by donor's PBMC. Results for patients Pt 01, Pt 02, Pt 03, Pt 05, and Pt 06 are shown.
Dystrophin‐specific T‐cell responses were measured by IFN‐γ ELISpot at two time points: before the beginning of treatment (PRE, white bar) and 2 months after the fourth infusion (black bar). PBMC were challenged with a library of 15‐mer overlapping peptides covering the protein sequence (pool 1–8). Polyclonal stimulation (phytohemagglutinin, PHA) was used as a positive control. The gray area represents the threshold calculated on a cohort of healthy donors. Results for Pt 01, Pt 02, Pt 03, Pt 05, and Pt 06 are shown.
References
-
- Arechavala‐Gomeza V, Kinali M, Feng L, Brown SC, Sewry C, Morgan JE, Muntoni F (2010) Immunohistological intensity measurements as a tool to assess sarcolemma‐associated protein expression. Neuropathol Appl Neurobiol 36: 265–274 - PubMed
-
- Benedetti S, Hoshiya H, Tedesco FS (2013) Repair or replace? Exploiting novel gene and cell therapy strategies for muscular dystrophies. FEBS J 280: 4263–4280 - PubMed
-
- Buyse GM, Voit T, Schara U, Straathof CS, D'Angelo MG, Bernert G, Cuisset JM, Finkel RS, Goemans N, McDonald CM et al (2015) Efficacy of idebenone on respiratory function in patients with Duchenne muscular dystrophy not using glucocorticoids (DELOS): a double‐blind randomised placebo‐controlled phase 3 trial. Lancet 385: 1748–1757 - PubMed
-
- Davies KE, Nowak KJ (2006) Molecular mechanisms of muscular dystrophies: old and new players. Nat Rev Mol Cell Biol 7: 762–773 - PubMed
Publication types
MeSH terms
Grants and funding
LinkOut - more resources
Full Text Sources
Other Literature Sources
Research Materials
