Comparative Study
. 2016 Mar;15(3):834-53.
doi: 10.1074/mcp.M115.053421. Epub 2015 Nov 5.

Monitoring Cellular Phosphorylation Signaling Pathways into Chromatin and Down to the Gene Level

Affiliations
Comparative Study

Monitoring Cellular Phosphorylation Signaling Pathways into Chromatin and Down to the Gene Level

Yumiao Han et al. Mol Cell Proteomics. 2016 Mar.

Abstract

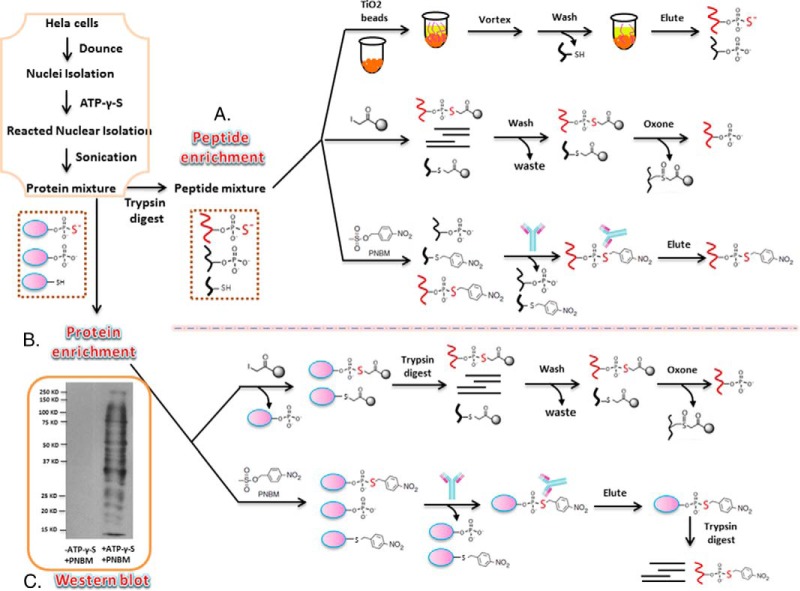
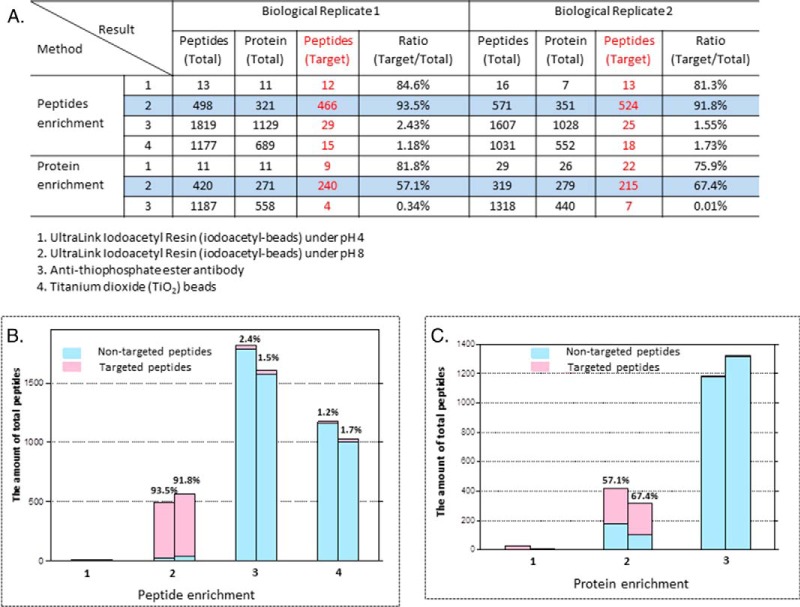
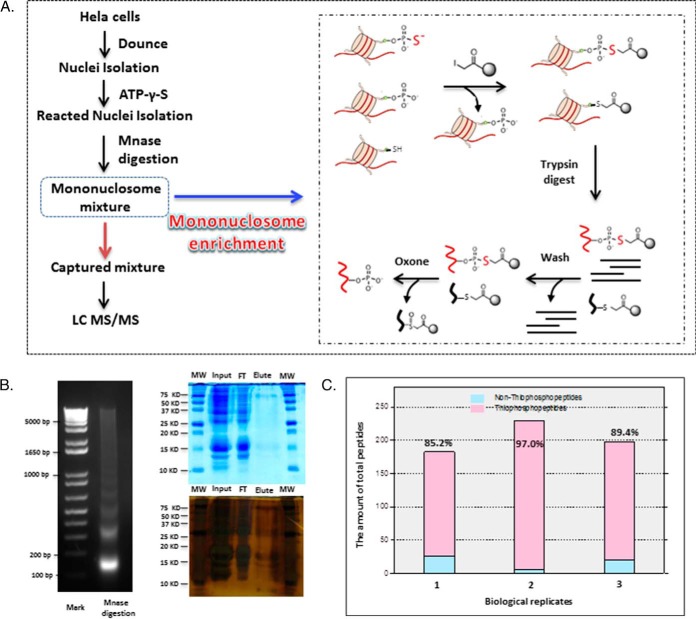
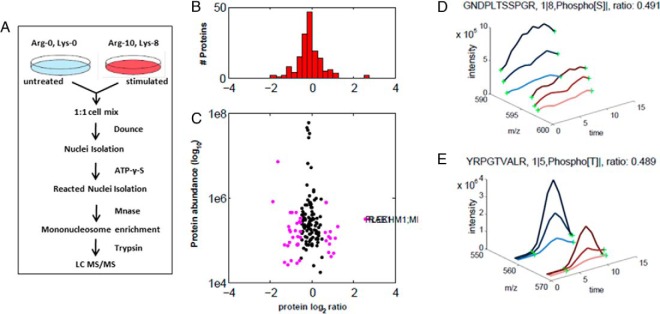
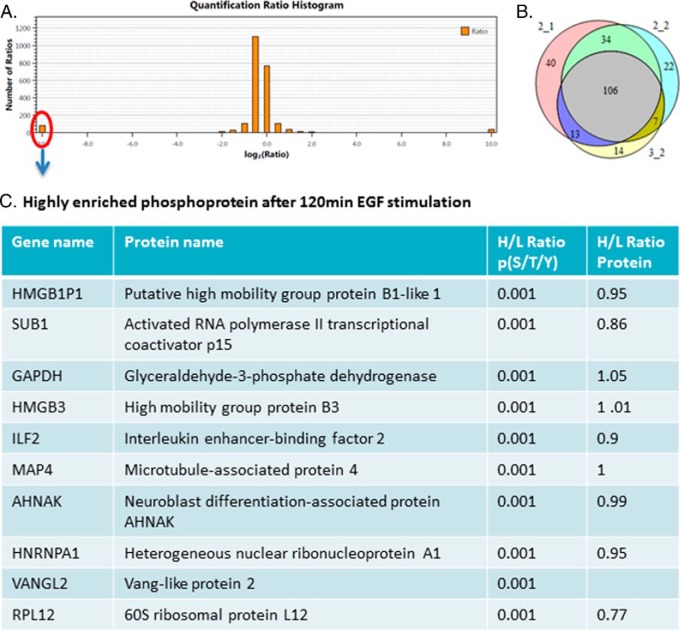
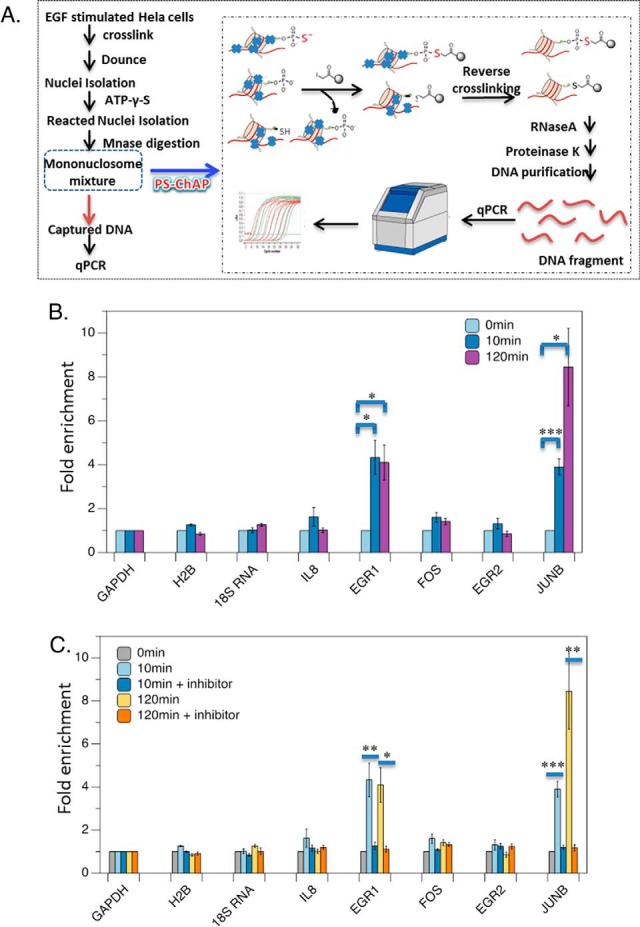
Protein phosphorylation, one of the most common and important modifications of acute and reversible regulation of protein function, plays a dominant role in almost all cellular processes. These signaling events regulate cellular responses, including proliferation, differentiation, metabolism, survival, and apoptosis. Several studies have been successfully used to identify phosphorylated proteins and dynamic changes in phosphorylation status after stimulation. Nevertheless, it is still rather difficult to elucidate precise complex phosphorylation signaling pathways. In particular, how signal transduction pathways directly communicate from the outer cell surface through cytoplasmic space and then directly into chromatin networks to change the transcriptional and epigenetic landscape remains poorly understood. Here, we describe the optimization and comparison of methods based on thiophosphorylation affinity enrichment, which can be utilized to monitor phosphorylation signaling into chromatin by isolation of phosphoprotein containing nucleosomes, a method we term phosphorylation-specific chromatin affinity purification (PS-ChAP). We utilized this PS-ChAP(1) approach in combination with quantitative proteomics to identify changes in the phosphorylation status of chromatin-bound proteins on nucleosomes following perturbation of transcriptional processes. We also demonstrate that this method can be employed to map phosphoprotein signaling into chromatin containing nucleosomes through identifying the genes those phosphorylated proteins are found on via thiophosphate PS-ChAP-qPCR. Thus, our results showed that PS-ChAP offers a new strategy for studying cellular signaling and chromatin biology, allowing us to directly and comprehensively investigate phosphorylation signaling into chromatin to investigate if these pathways are involved in altering gene expression. The mass spectrometry proteomics data have been deposited to the ProteomeXchange Consortium with the data set identifier PXD002436.


Figures

Fig. 1.
Fig. 1.
Overview of enrichment methods for thiophosphorylated peptides and proteins. The orange box displays the work flow to prepare the peptides and protein mixtures before the enrichment. (A) Schematic of different methods to enrich thiophosphopeptides, which include titanium dioxide (TiO2) beads, UltraLink iodoacetyl resin (iodoacetyl-beads), and an anti-thiophosphate ester antibody. After all the steps, peptides are eluted and analyzed by nanoLC-MS/MS. (B) Schematic of different methods used for thiophosphoprotein enrichment. The methods include UltraLink iodoacetyl resin (iodoacetyl-beads) and anti-thiophosphate ester antibody. After all the steps, peptides are eluted and analyzed by nanoLC-MS/MS. (C) PNBM derivatized thiophosphorylated proteins detected by Western blotting using the anti-thiophosphate ester antibody. The first lane shows that HeLa nuclei only using alkylation with PNBM (but without ATP-γ-S), and the second lane shows HeLa nuclei incubated with ATP-γ-S followed by alkylation with PNBM.
Fig. 2.
Fig. 2.
Comparison of the enrichment efficiency for thiophosphopeptide and thiophosphoprotein isolation. (A) Table showing the results of two biological replicates for the various enrichment strategies (Method 1: iodoacetyl resin, pH 4; Method 2: iodoacetyl resin, pH 8; Method 3: anti-thiophosphate ester antibody; and Method 4: TiO2 beads). For this comparison, the identified numbers of total peptides, total protein, target peptides (thiophosphopeptides or phosphopeptides), and the ratio of target peptides/total peptides are displayed. (B) Histogram showing the enrichment efficiency for thiophosphopeptide isolation. The X-axis represents different methods as listed in A, while the Y-axis shows the amount of peptides identified. The numbers of nontargeted peptides identified are shown in light blue and targeted peptides are shown in pink. (C) Histogram showing shows the enrichment efficiency toward thiophosphoprotein isolations. The X-axis represents different methods while the Y-axis shows the amount of target peptides identified. Light blue indicates the amount of nontargeted peptides identified, while pink indicates the amount of targeted peptides identified.
Fig. 3.
Fig. 3.
Phosphorylation specific chromatin affinity purification (PS-ChAP) for mononucleosome enrichment. (A) Illustration of the steps in the PS-ChAP strategy performed on a mononucleosome mixture after MNase digestion. By using iodoacetyl-beads, thiophosphorylated mononucleosomes can be isolated. After trypsin digestion, washes, and elution, thiophosphorylated sites on the mononucleosomes can be specifically detected using nanoLC-MS/MS. (B) The left figure shows the electrophoretic gel analysis of micrococcal nuclease-digested chromatin, and the right two figures show protein gels using Coomassie blue and silver staining. 0.05% of the total input protein and flow-through protein were loaded while the entire elution solution was loaded on the gel. (C) Three biological replicates were performed, and the figure shows the efficiency of this method for mononucleosome enrichment. The X-axis represents different biological replicates while the Y-axis shows the amount of peptides identified. The amount of nonphosphopeptides identified is shown in light blue and phosphopeptides are shown in pink.
Fig. 4.
Fig. 4.
Analysis of PS-ChAP SILAC results under amanitin treatment for identifying phosphorylation events related to gene transcription. (A) Light amino acids (Lys0; Arg0) or heavy amino acids (Lys8; Arg10) were used for the SILAC experiment. Untreated cells were grown in the light medium while the stimulated cells were grown in the heavy medium. Cells were mixed in a 1:1 ratio, and whole cell lysis was performed before nuclei isolation and Mnase digestion. As described in Fig. 3, thiophosphorylated sites on the mononucleosomes can be specifically detected from nanoLC-MS/MS after thiophosphorylated mononucleosome enrichment. Light-labeled HeLa cells served as a control while heavy-labeled HeLa cells were treated with α-amanitin for 24h. (B) Histogram of log2-transformed normalized protein ratios for all quantified proteins identified in the experiment. (C) Plot of the normalized ratios of all quantified proteins plotted against their summed heavy and light peptide intensities. (D) MS-based quantification analysis of a phosphopeptide on MCM2 (GDPLTSpSPR) that displays a decreased abundance during inhibition of transcription. The SILAC peptide pair shows a heavy to light ratio (H/L) of 0.489 corresponding to a more than twofold reduction of the protein level. (E) MS-based quantification analysis of another peptide on histone H3 (YRPGpTVALR). The SILAC peptide pair shows a heavy to light ratio (H/L) of 0.491 also corresponding to about twofold reduction of the protein level.
Fig. 5.
Fig. 5.
Quantitative SILAC-based proteomics and PS-ChAP reveal phosphorylation events related to gene transcription. (A) Pairs of chemically identical peptides (GNDPLTSpSPGR) with a different stable-isotope composition can be differentiated by mass spectrometry due to the mass difference between the pair (Δm = 5 m/z). The relative protein abundance was reflected by comparing the differences in the intensities of the peaks. (B) MS/MS spectra obtained for GNDPLTSpSPGR ([M+2H]2+ = 595.758). The sequence, modification, and peptide spectrum match score are listed on the top of the figure. The y-type fragment ions are shown in yellow while the b-type fragment ions are shown in green. (C) MS quantification result of GNDPLTSpSPGR from combined control and α-amanitin treated cells were obtained by using pQuant. Western blotting results are shown in the second part of the panel and are consistent with the MS observations.
Fig. 6.
Fig. 6.
Histone H3T45 phosphorylation identified as potentially associated to transcription. (A) Pairs of chemically identical peptides (YRPGpTVALR) with a different stable-isotope composition can be differentiated by mass spectrometry due to the mass difference between the pair as shown in the image. The relative protein abundance was reflected by comparing the differences in the intensities of the peaks (Δm = 10 m/z). (B) MS/MS spectra obtained for YRPGpTVALR. The sequence, modification, and score are listed on the top of the figure. The y-type fragment ions are showing in yellow while the b-type fragment ions are showing in green. (C) Structural positions of H3Thr45 site in the nucleosome (PDB ID: 1KX5) (Davey et al. 2002). The position of H3Thr45 (red) is indicated by the arrows; H3Thr45 is located at the N terminus of the first helix of H3 (the αN1-helix), a position close to where the DNA both enters and exits the nucleosome. Images were constructed using the PyMOL software. (D) According to recent literature, RNA polymerase II and histone methyltransferase Set2 interact with the structured nucleosome core surface formed by the listed residues in the figure, including H3Thr45.
Fig. 7.
Fig. 7.
PS-ChAP SILAC-based quantitative proteomics analysis during serum deprivation followed by serum replenishing. Light-labeled HeLa cells were serum starved for 72 h and heavy-labeled HeLa cells were starved 72 h then refed with 10% FBS serum for 4 h. (A) Histogram of log2-transformed normalized protein ratios for all quantified proteins identified in the experiment. (B) Plot of the normalized ratios of all quantified proteins plotted against their summed heavy and light peptide intensities. (C) MS-based quantification analysis of the LMO7 peptide (RGESLDNLDpSPR). SILAC peptide pair shows a heavy to light ratio (H/L) of 0.428 corresponding to a more than twofold reduction of the protein level. (D) MS-based quantification analysis of the C19orf21 peptide (GRPpSLYVQR). SILAC peptide pair shows a heavy to light ratio (H/L) of 0.685 corresponding to slightly less than twofold reduction of the protein level.
Fig. 8.
Fig. 8.
SILAC-based quantitative proteomics for temporal analysis of the EGF signaling network. 10 min EGF-stimulated cells were grown in the standard “light” medium and nonstimulated cells were grown in the medium containing isotopically heavy l-arginine and l-lysine. (A) Histogram of log2-transformed normalized peptides ratios (heavy/light) for all quantified peptides identified in the experiment. (B) Number of proteins identified in three biological replicates. (C) Table listing some of the highly enriched phosphoproteins after 10 min EGF stimulation. The first line is the gene name, second line is the protein name, third line is the phosphopeptide ratio, and the last line is the protein ratio according to the ratio of many nonphosphopeptides of the protein found in the flow-through.
Fig. 9.
Fig. 9.
SILAC-based quantitative proteomics for temporal analysis of EGF signaling network. 120 min EGF-stimulated cells were grown in the standard “light” medium and non-stimulated cells were grown in the medium containing isotopically heavy l-arginine and l-lysine. (A) Histogram of log2-transformed normalized peptide ratios (heavy/light) for all quantified peptides identified in the experiment. (B) Number of proteins identified in three biological replicates. (C) Table listing some of the highly enriched phosphoproteins after 120 min EGF stimulation. The first line is the gene name, second line is the protein name, third line is the phosphopeptide ratio, and the last line is the protein ratio according to the ratio of many nonphosphopeptides of the protein found in the flow-through.
Fig. 10.
Fig. 10.
PS-ChAP for monitoring gene expression linked to cellular signaling. (A) EGF stimulated cells are crosslinked and then dounced to get the nuclear pellet followed by treating with ATP-γ-S. Illustration of the steps in the PS-ChAP strategy performed on a mononucleosome mixture after MNase digestion. By using iodoacetyl-beads, thiophosphorylated mononucleosomes can be isolated. Afterward, crosslinks were reversed and PS-ChAP captured DNA was purified and amplified by qPCR. (B) HeLa cells were serum starved for 24 h in media without serum and then treated with 100 ng/ml EGF for 10 min or 120min. Cells were harvested, and DNA was purified and analyzed by qPCR as shown in Fig. 10A. Statistically significant changes are indicated as ***p < .005, **p < .02 and *p < .05. (C) HeLa cells were serum starved for 24 h in media without serum, pretreated with 10 μm PD98059 for 1 h and then treated with 100 ng/ml EGF for 10min or 120min. Cells were harvested, and DNA was purified and analyzed by qPCR as shown in Fig. 10A. Values are relative to MEK-inhibitor-treated cells. Statistically significant changes are indicated as ***p < .005, **p < .02 and *p < .05. p values were calculated using the two-tailed unpaired Student's t test with equal variances. All error bars represent s.d. Data in parts B and C are the result of triplicate independent biological experiments.

References

    1. Cohen P. (2002) The origins of protein phosphorylation. Nat. Cell Biol. 4, E127–E130 - PubMed
    1. Hunter T. (1995) Protein kinases and phosphatases: The yin and yang of protein phosphorylation and signaling. Cell 80, 225–236 - PubMed
    1. Hunter T. (2000) Signaling—2000 and beyond. Cell 100, 113–127 - PubMed
    1. Cohen P. (2001) The role of protein phosphorylation in human health and disease. Eur. J. Biochem. 268, 5001–5010 - PubMed
    1. Hubbard M. J., and Cohen P. (1993) On target with a new mechanism for the regulation of protein phosphorylation. Trends Biochem. Sci. 18, 172–177 - PubMed

Publication types

Associated data