. 2015 Nov 6;11(11):e1005645.
doi: 10.1371/journal.pgen.1005645. eCollection 2015 Nov.

DNA Repair Cofactors ATMIN and NBS1 Are Required to Suppress T Cell Activation

Affiliations

DNA Repair Cofactors ATMIN and NBS1 Are Required to Suppress T Cell Activation

Jana Prochazkova et al. PLoS Genet. .

Abstract

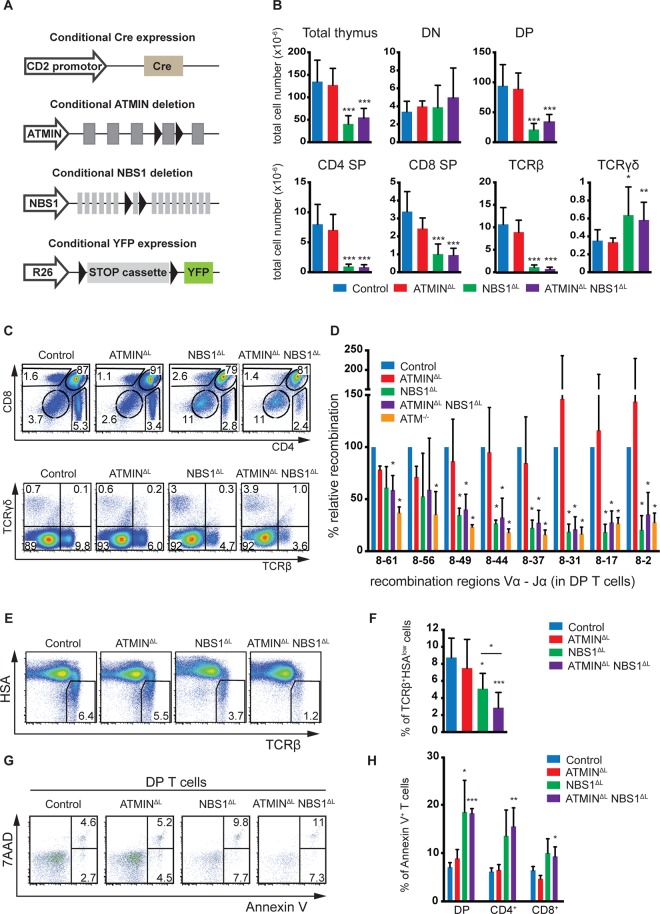
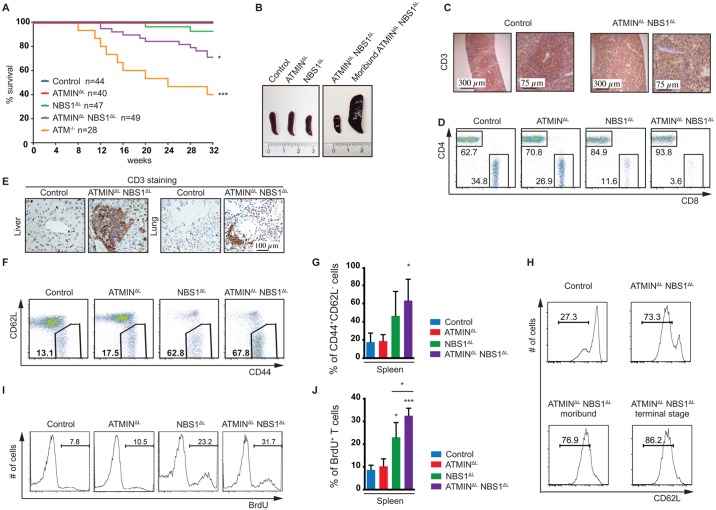
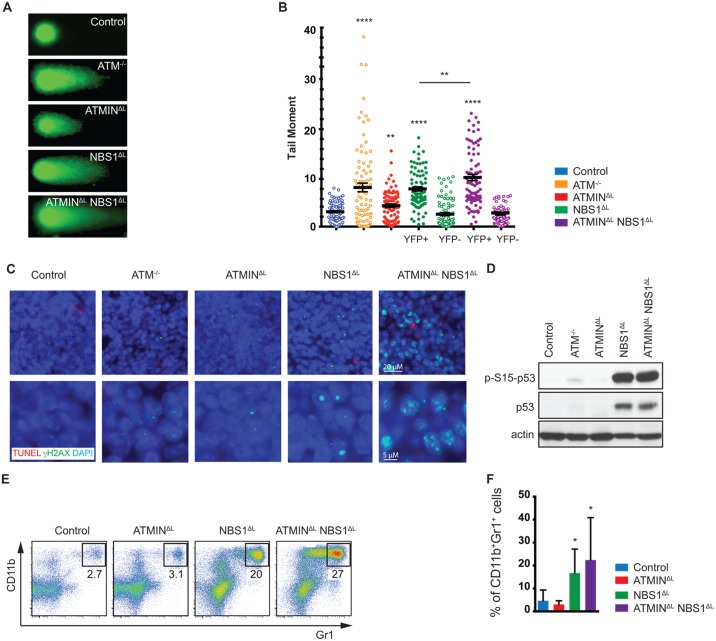
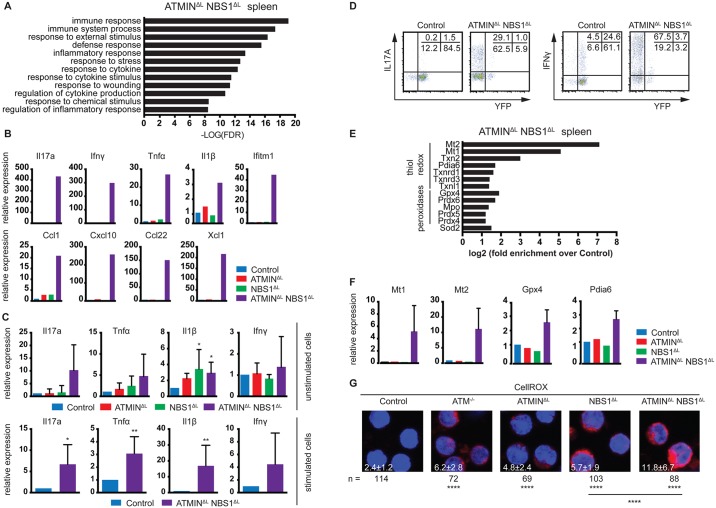
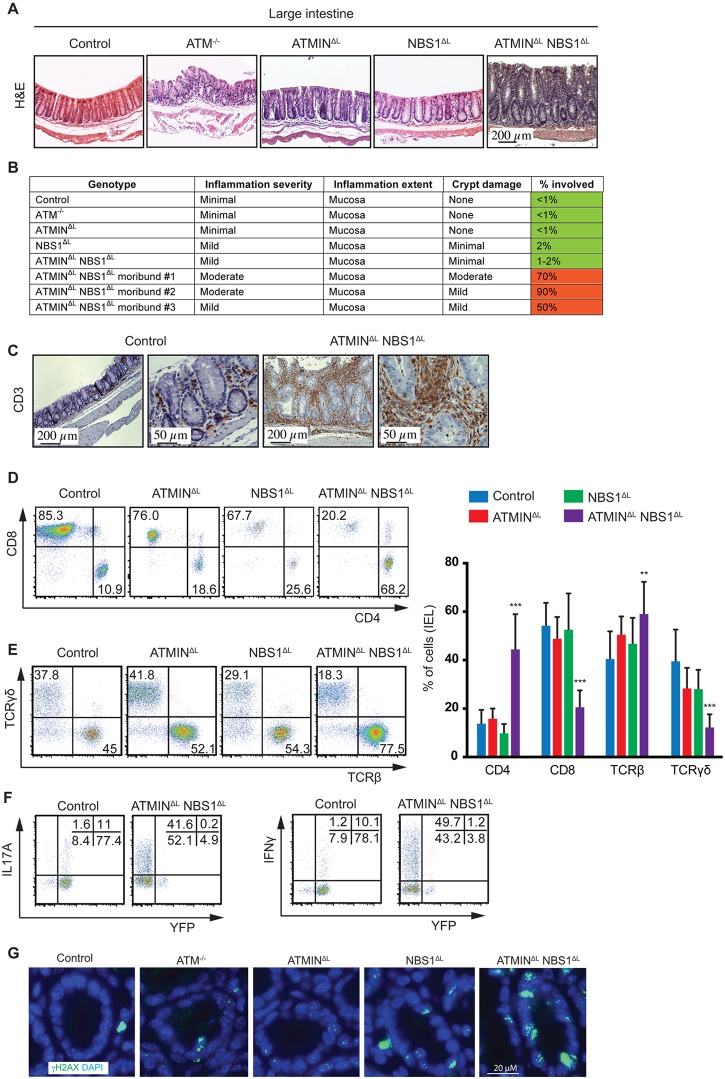
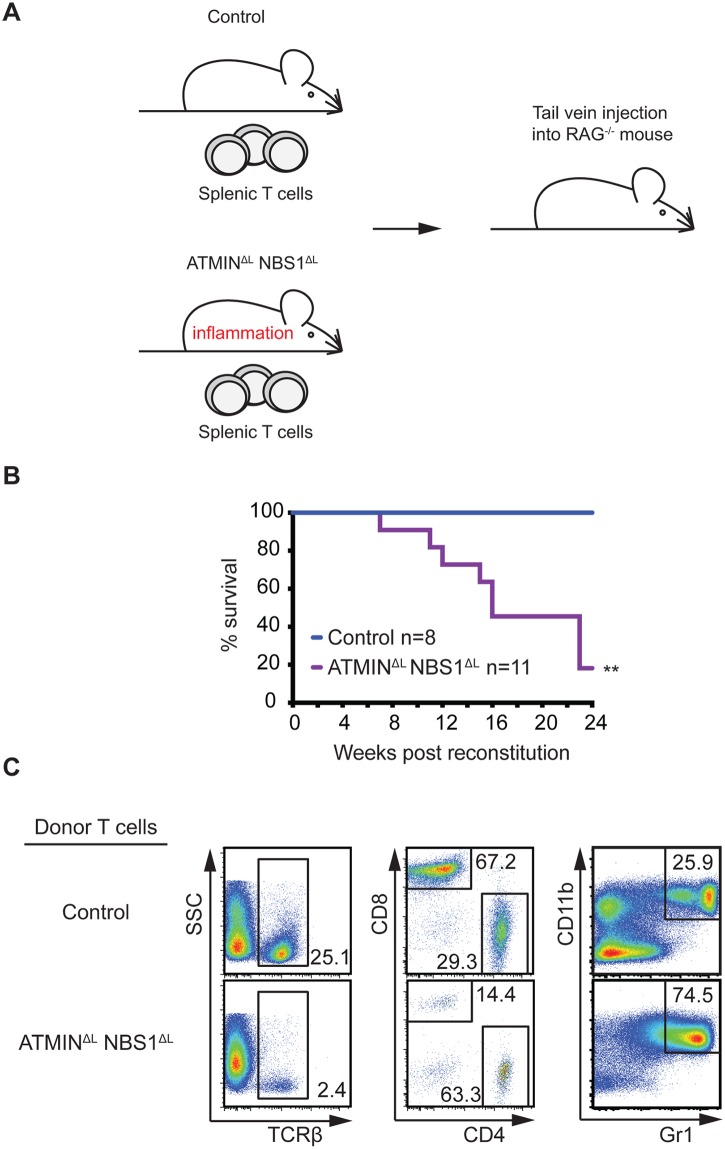
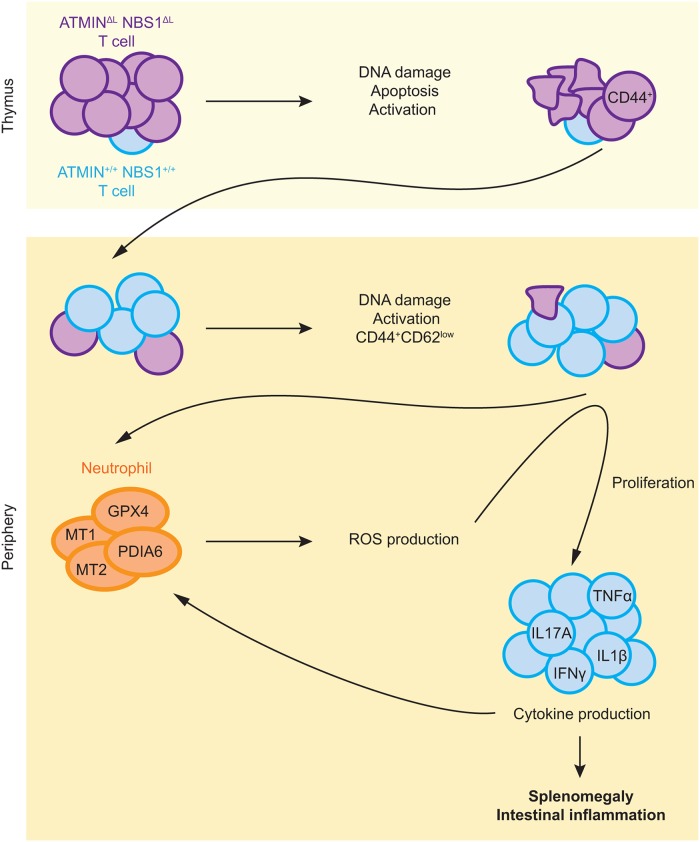
Proper development of the immune system is an intricate process dependent on many factors, including an intact DNA damage response. The DNA double-strand break signaling kinase ATM and its cofactor NBS1 are required during T cell development and for the maintenance of genomic stability. The role of a second ATM cofactor, ATMIN (also known as ASCIZ) in T cells is much less clear, and whether ATMIN and NBS1 function in synergy in T cells is unknown. Here, we investigate the roles of ATMIN and NBS1, either alone or in combination, using murine models. We show loss of NBS1 led to a developmental block at the double-positive stage of T cell development, as well as reduced TCRα recombination, that was unexpectedly neither exacerbated nor alleviated by concomitant loss of ATMIN. In contrast, loss of both ATMIN and NBS1 enhanced DNA damage that drove spontaneous peripheral T cell hyperactivation, proliferation as well as excessive production of proinflammatory cytokines and chemokines, leading to a highly inflammatory environment. Intriguingly, the disease causing T cells were largely proficient for both ATMIN and NBS1. In vivo this resulted in severe intestinal inflammation, colitis and premature death. Our findings reveal a novel model for an intestinal bowel disease phenotype that occurs upon combined loss of the DNA repair cofactors ATMIN and NBS1.


Conflict of interest statement

The authors have declared that no competing interests exist.

Figures

Fig 1
Fig 1. NBS1 is required for T cell development and TCRα recombination, which is largely unaffected by concomitant loss of ATMIN.
(A) Schematic representation of the strategy to conditionally delete ATMIN and/or NBS1. Exon 4 of ATMIN, exon 6 of NBS1 and a ‘stop’ cassette inserted upstream of the YFP reporter gene (on the Rosa26 locus, denoted as ‘R26’) were flanked by LoxP sites (denoted by arrow heads). Cre recombinase was expressed under the control of the CD2 promotor. (B) Total thymic cellularity and thymic numbers of double-negative (DN; CD4-CD8-), double-positive (DP; CD4+CD8+), CD4 single-positive (SP; CD4+CD8-), CD8 single-positive (SP; CD4-CD8+), TCRβ+ (TCRβ+ TCRγδ-) and TCRγδ (TCRβ- TCRγδ+) cells in control, ATMINΔL, NBS1ΔL and ATMINΔLNBS1ΔL mice. N = 4–10 mice per genotype. (C) Representative flow cytometry plots for B. (D) Quantitative PCR analysis of eight Vα8-Jα recombination regions in purified DP thymic T cells from control, ATMINΔL, NBS1ΔL, ATMINΔLNBS1ΔL and ATM-/- mice. Results are normalized to the control DP thymic T cells. N = 3 mice per genotype. (E) Representative flow cytometry plots of TCRβ+HSAlow mature thymocytes isolated from control, ATMINΔL, NBS1ΔL and ATMINΔLNBS1ΔL mice. N = 5–7 mice per genotype (F) Quantification of E. (G) Representative flow cytometry data of apoptotic and necrotic (Annexin V+ and Annexin V+ 7AAD+, respectively) DP thymocytes in mice indicated in E. N = 4–7 mice per genotype (H) Quantification of Annexin V+ cells within DP, CD4+ and CD8+ SP thymocytes. Error bars represent SEM (*P<0.05, **P<0.01, ***P<0.001).
Fig 2
Fig 2. Loss of ATMIN in combination with NBS1, in T cells, leads to increased mortality due to T cell activation.
(A) Kaplan-Meier survival curve of control, ATMINΔL, NBS1ΔL, ATMINΔLNBS1ΔL and ATM-/- mice. Survival was monitored for 32 weeks. (B) Representative images of spleens of control, ATMINΔL, NBS1ΔL and ATMINΔLNBS1ΔL mice as well as a moribund ATMINΔLNBS1ΔL mouse. (C) Histological analysis of the spleen of a control and a moribund ATMINΔLNBS1ΔL mouse stained for T cells using an anti-CD3 antibody. (D) Representative flow cytometry data of CD4 and CD8 T cells (gated on the TCRβ+ population) in the spleen of control, ATMINΔL, NBS1ΔL and ATMINΔLNBS1ΔL mice. (E) Histological analysis by using an anti-CD3 antibody to visualize T cells in the liver and lung of control and ATMINΔLNBS1ΔL mice. (F) Representative flow cytometry data of activated CD62LlowCD44+ T cells (gated on the TCRβ+ population) in the spleen of control, ATMINΔL, NBS1ΔL and ATMINΔLNBS1ΔL mice. (G) Quantification of F. N = 3–4 mice per genotype. (H) Flow cytometry data showing the percentage of antigen-experienced CD62LlowCD4+ T cells (gated on the TCRβ+ population) in the spleen of control and ATMINΔLNBS1ΔL mice as well as moribund ATMINΔLNBS1ΔL mice. (I) Representative flow cytometry data of proliferating (BrdU+) T cells (gated on the TCRβ+ population) in the spleen of mice indicated in F, measured by in vivo BrdU incorporation over a period of 4 days. (J) Quantification of I. N = 3–4 mice per genotype. Error bars represent SEM (*P<0.05, ***P<0.001).
Fig 3
Fig 3. Loss of ATMIN and NBS1 in T cells leads to the accumulation of DNA damage.
(A) Representative images of FACS sorted (for TCRβ+ populations) splenic T cells from control, ATM-/-, ATMINΔL, NBS1ΔL and ATMINΔLNBS1ΔL mice, analysed using the alkali comet assay. (B) Quantification of A. N = 3 mice per genotype. FACS sorted splenic T cells from NBS1ΔL and ATMINΔLNBS1ΔL mice were additionally sorted and analysed based on YFP expression. (C) Splenic sections from control, ATM-/-, ATMINΔL, NBS1ΔL and ATMINΔLNBS1ΔL mice were co-stained for TUNEL and γH2AX. Nuclei were counterstained with DAPI. (D) Western blot analysis of splenic cells from control, ATM-/-, ATMINΔL, NBS1ΔL and ATMINΔLNBS1ΔL mice for pS15-p53, total p53 and actin. (E) Representative flow cytometry data of CD11b+Gr1+ neutrophils in the spleen of control, ATMINΔL, NBS1ΔL and ATMINΔLNBS1ΔL mice. (F) Quantification of E. N = 7–10 mice per genotype. Error bars represent SEM (*P<0.05, **P<0.01, **** P<0.0001).
Fig 4
Fig 4. ATMINΔLNBS1ΔL mice display enhanced cytokine and ROS production.
(A) Gene ontology analysis of processes enriched in the spleen of ATMINΔLNBS1ΔL mice identified by mRNA-sequencing. (B) Quantitative RT-PCR analysis of selected genes found to be enriched in A in the spleens of control, ATMINΔL, NBS1ΔL and ATMINΔLNBS1ΔL mice. Gene expression is normalized to mef1α control. (C) Quantitative RT-PCR analysis of expression of proinflammatory cytokines Il17a, Tnfα, Il1β and Ifnγ in splenic T cells of indicated mice with or without 12 hours in vitro stimulation with anti-CD3 and anti-CD28 antibodies. Gene expression is normalized to mef1α control. N = 4–8 mice per genotype. (D) Representative intracellular expression of IL17A and IFNγ assessed by flow cytometry, in YFP- and YFP+ T (gated on the CD4+ population) cells in the spleen of control and ATMINΔLNBS1ΔL mice after PMA and ionomycin stimulation. (E) Enrichment analysis of anti-oxidative genes in the spleen of ATMINΔLNBS1ΔL mice identified by mRNA-sequencing. (F) Quantitative RT-PCR analysis of selected genes found to be enriched in E in the spleens of control, ATMINΔL, NBS1ΔL and ATMINΔLNBS1ΔL mice. Gene expression is normalized to mef1α control. (G) Splenic cells from control, ATM-/-, ATMINΔL, NBS1ΔL and ATMINΔLNBS1ΔL mice were stained with the CellROX reagent and counterstained with Hoechst 33258. Error bars represent SEM (*P<0.05, **P<0.01, ****P<0.0001).
Fig 5
Fig 5. Loss of ATMIN and NBS1 leads to intestinal inflammation due to infiltration of cytokine-producing T cells.
(A) Histological analysis by H&E staining of large intestine of control, ATM-/-, ATMINΔL, NBS1ΔL, ATMINΔLNBS1ΔL mice at 12 weeks of age. (B) Histological scores of the large intestine of control, ATM-/-, ATMINΔL, NBS1ΔL, ATMINΔLNBS1ΔL and 3 individual moribund ATMINΔLNBS1ΔL mice. (C) Histological analysis by anti-CD3 staining of the large intestine of control and a moribund ATMINΔLNBS1ΔL mouse. (D) Representative flow cytometry data of CD4 and CD8 expression, as well as (E) TCRβ and TCRγδ expression on isolated IELs from the small intestine of control, ATMINΔL, NBS1ΔL and ATMINΔLNBS1ΔL mice, along with the quantification of D-E. N = 5–8 mice per genotype. (F) Representative flow cytometry data of IL17A and IFNγ production by YFP- and YFP+ IELs (gated on the CD4+ population) isolated from the small intestine of control and ATMINΔLNBS1ΔL mice after PMA and ionomycin stimulation. (G) Large intestinal sections from control, ATM-/-, ATMINΔL, NBS1ΔL and ATMINΔLNBS1ΔL mice were stained for γH2AX and DAPI. Error bars represent SEM (**P<0.01, ***P<0.001).
Fig 6
Fig 6. Systemic inflammation in ATMINΔLNBS1ΔL mice is T cell intrinsic.
(A) Model for the reconstitution of RAG-/- mice reconstituted with intravenously injected with CD3+ TCRβ+ sorted splenic T cells from control or ATMINΔLNBS1ΔL mice. (B) Kaplan-Meier survival curve of RAG-/- mice that were reconstituted as in A. Survival was monitored for 24 weeks post reconstitution. (C) Representative flow cytometry plots of TCRβ+ T cells as well as CD4+ and CD8+ T cells (gated on the TCRβ+ population) and Gr1+CD11+ neutrophils in the spleen of RAG-/- mice injected with control or ATMINΔLNBS1ΔL T cells. **P<0.01.
Fig 7
Fig 7. Mice deficient for ATMIN and NBS1 in T cells produce inflammatory cytokines in the intestine and are hypersensitive to colitis.
(A-C) Quantitative RT-PCR analysis of expression of proinflammatory cytokines Il17a, Tnfα and Il1β in the IELs of control, ATMINΔL, NBS1ΔL and ATMINΔLNBS1ΔL with (‘anti-CD3/CD28’) or without (‘unstim’) 12 hour in vitro stimulation with anti-CD3 and anti-CD28 antibodies. Gene expression is normalized to mef1α control. N = 4–8 mice per genotype. (D) Percentage of weight change upon DSS treatment of ATMINΔL, NBS1ΔL, ATMINΔLNBS1ΔL and ATM-/- mice for 8 days. Each genotype is normalized to its respective control. N = 4 mice per genotype. (E-G) Quantitative RT-PCR analysis of expression of proinflammatory cytokines Il17a, Tnfα and Ifnγ in small intestine of DSS treated (‘+DSS’) or untreated (‘-DSS’) control, ATMINΔL, NBS1ΔL and ATMINΔLNBS1ΔL mice. N = 4 mice per genotype. (H) Histological analysis by H&E staining of large intestine of DSS treated control and ATMINΔLNBS1ΔL mice. (I) Histological analysis of control and ATMINΔLNBS1ΔL mice without (water) or with DSS. Error bars represent SEM (*P<0.05, **P<0.01, ***P<0.001).
Fig 8
Fig 8. Model for the role of ATMIN and NBS1 in suppressing T cell activation and inflammation.
Proposed model depicting mechanisms of inflammation caused by concomitant deletion of ATMIN and NBS1 (details can be found in the text).

References

    1. Dudley DD, Chaudhuri J, Bassing CH, Alt FW (2005) Mechanism and control of V(D)J recombination versus class switch recombination: similarities and differences. Adv Immunol 86: 43–112. - PubMed
    1. Shiloh Y, Ziv Y (2013) The ATM protein kinase: regulating the cellular response to genotoxic stress, and more. Nat Rev Mol Cell Biol 14: 197–210. 10.1038/nrm3546 - DOI - PubMed
    1. Barlow C, Hirotsune S, Paylor R, Liyanage M, Eckhaus M, et al. (1996) Atm-deficient mice: a paradigm of ataxia telangiectasia. Cell 86: 159–171. - PubMed
    1. Callen E, Jankovic M, Difilippantonio S, Daniel JA, Chen HT, et al. (2007) ATM prevents the persistence and propagation of chromosome breaks in lymphocytes. Cell 130: 63–75. - PubMed
    1. Camacho E, Hernandez L, Hernandez S, Tort F, Bellosillo B, et al. (2002) ATM gene inactivation in mantle cell lymphoma mainly occurs by truncating mutations and missense mutations involving the phosphatidylinositol-3 kinase domain and is associated with increasing numbers of chromosomal imbalances. Blood 99: 238–244. - PubMed

Publication types