. 2015 Nov 5;163(4):907-19.
doi: 10.1016/j.cell.2015.10.022.

Vesicle-Mediated Steroid Hormone Secretion in Drosophila melanogaster

Affiliations

Vesicle-Mediated Steroid Hormone Secretion in Drosophila melanogaster

Naoki Yamanaka et al. Cell. .

Abstract

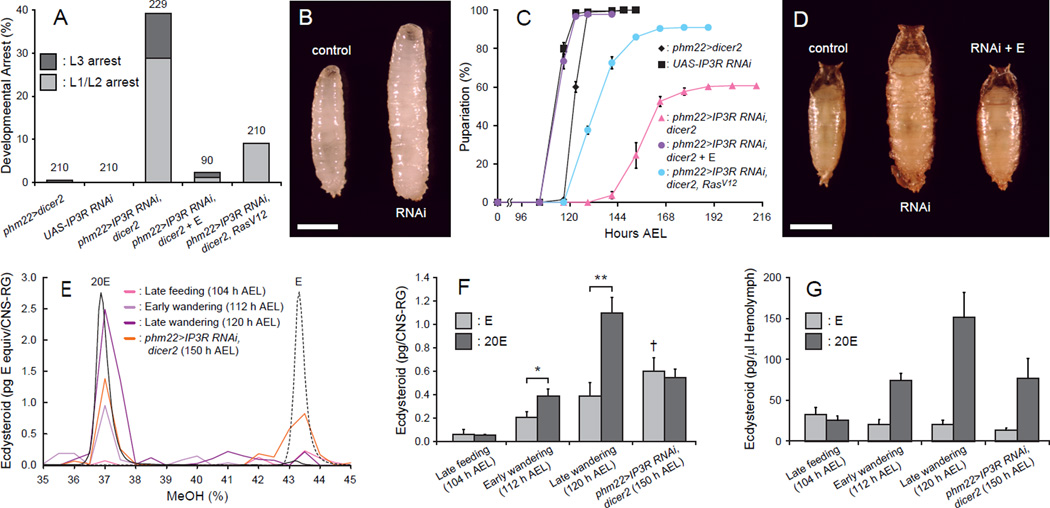
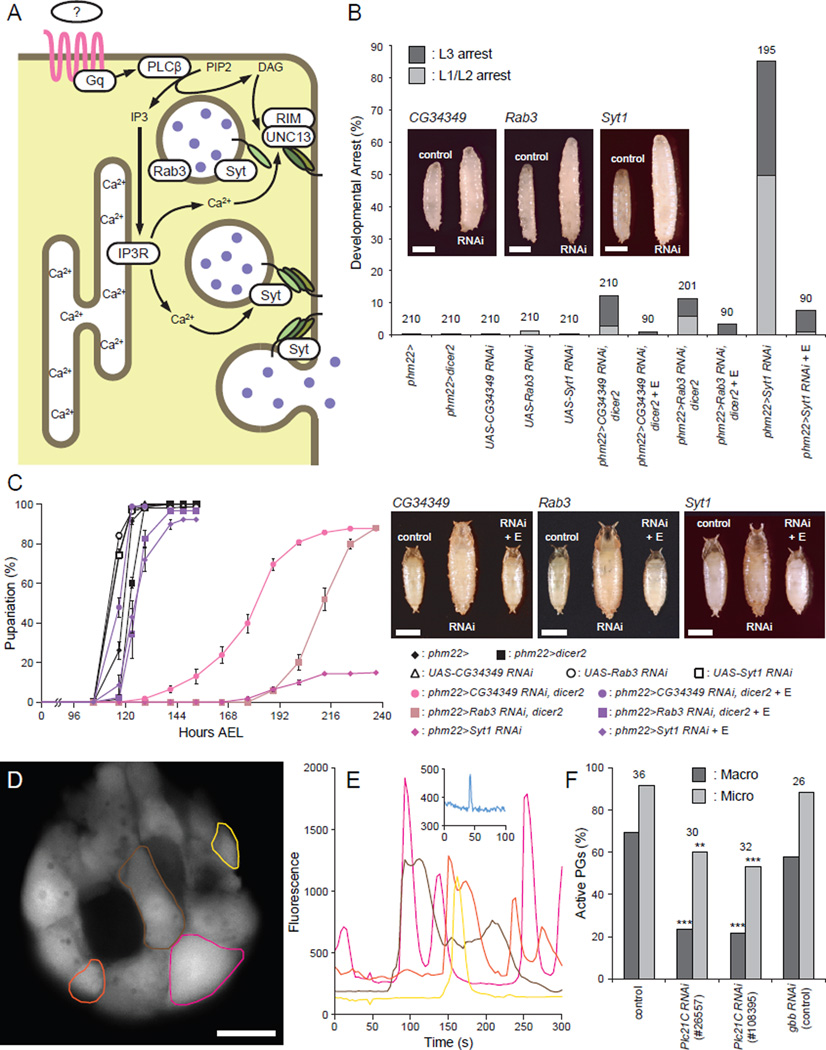
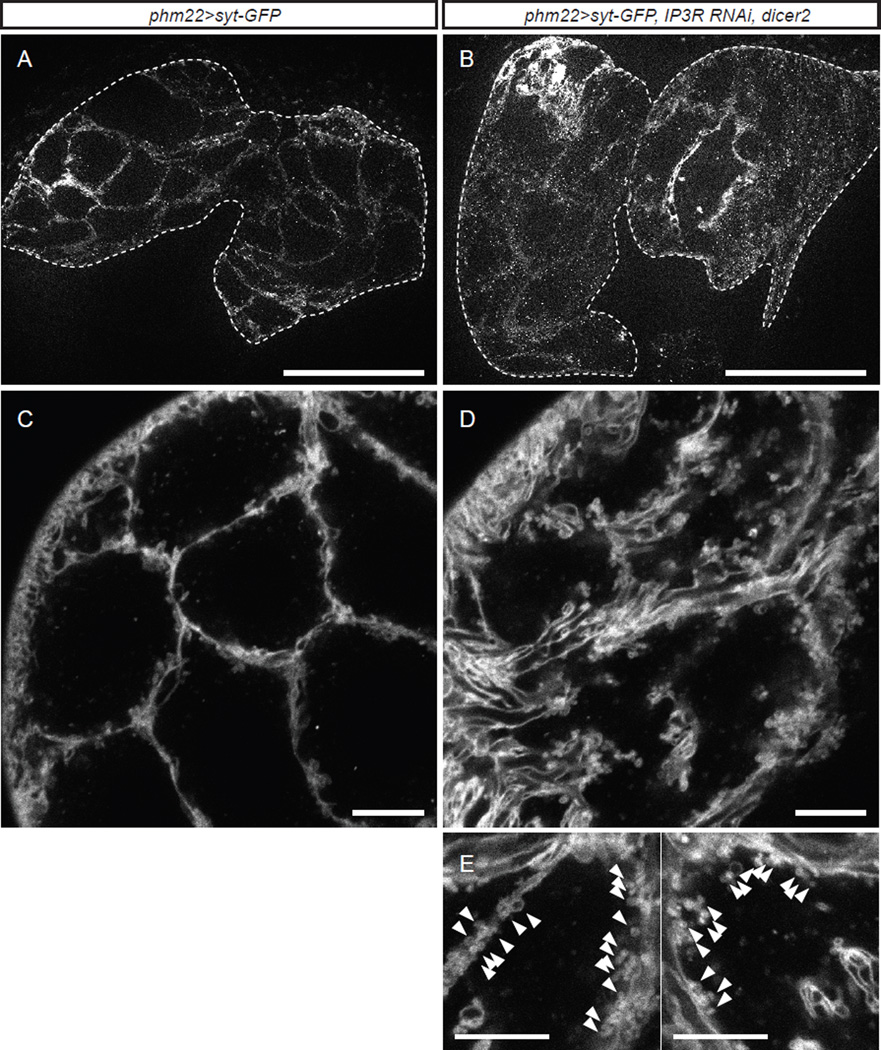
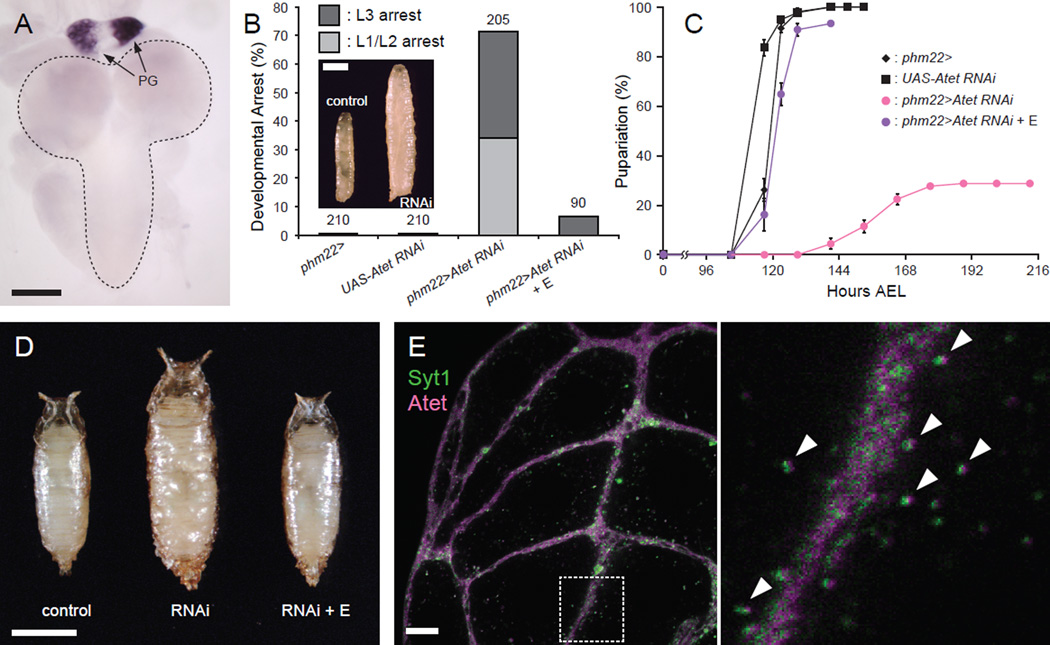
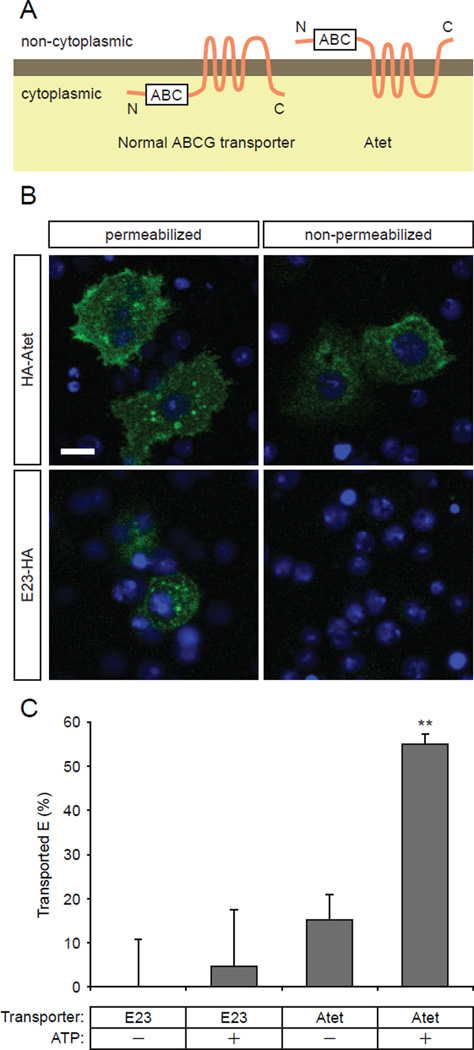
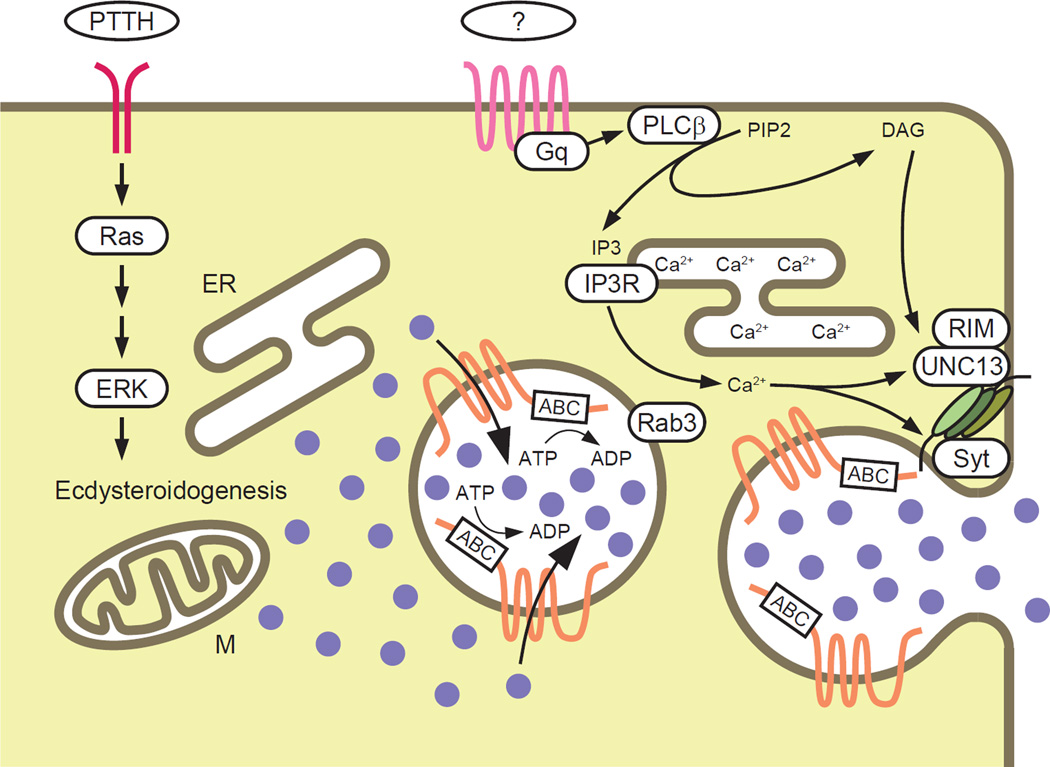
Steroid hormones are a large family of cholesterol derivatives regulating development and physiology in both the animal and plant kingdoms, but little is known concerning mechanisms of their secretion from steroidogenic tissues. Here, we present evidence that in Drosophila, endocrine release of the steroid hormone ecdysone is mediated through a regulated vesicular trafficking mechanism. Inhibition of calcium signaling in the steroidogenic prothoracic gland results in the accumulation of unreleased ecdysone, and the knockdown of calcium-mediated vesicle exocytosis components in the gland caused developmental defects due to deficiency of ecdysone. Accumulation of synaptotagmin-labeled vesicles in the gland is observed when calcium signaling is disrupted, and these vesicles contain an ABC transporter that functions as an ecdysone pump to fill vesicles. We propose that trafficking of steroid hormones out of endocrine cells is not always through a simple diffusion mechanism as presently thought, but instead can involve a regulated vesicle-mediated release process.


Figures

Figure 1
Figure 1. IP3R Is Required for E Secretion from the PG
(A) IP3R-knockdown in the PG causes polyphasic growth arrest. Percentages of developmentally arrested larvae for each genotype are shown. Percentages of larvae arrested at first or second instar (L1/L2) are indicated in light gray, whereas those arrested at third instar (L3) are shown in dark gray. E feeding is indicated by + E. Numbers of animals tested are shown on top of each bar. (B) IP3R-knockdown in the PG causes overgrowth at L3. Representative image of a wandering control larva (control, phm22>dicer2) and an IP3R-knockdown larva arrested as L3 (RNAi, phm22>IP3R RNAi, dicer2). Scale bar, 1 mm. (C) IP3R-knockdown in the PG causes developmental delay. Developmental time to pupariation of nonarrested larvae is shown. AEL, after egg laying. Data are represented as mean ± SEM of 3–7 independent experiments. (D) IP3R-knockdown in the PG leads to the formation of overgrown pupae. Representative image of a control pupa (control, phm22>dicer2), an IP3R-knockdown pupa (RNAi, phm22>IP3R RNAi, dicer2) and an IP3R-knockdown pupa rescued by E feeding (RNAi + E, phm22>IP3R RNAi, dicer2 with E feeding) is shown. Scale bar, 1 mm. (E) Separation of E and 20E by a methanol (MeOH) gradient on reverse-phase HPLC. UV absorbance profiles at 248 nm of standard E (dashed black line) and 20E (solid black line) are shown on an arbitrary scale. The relative quantity of ecdysteroids in CNS-RG complexes of different groups of animals are shown in solid colored lines as E equivalent (pg) in each fraction. Fractions corresponding to 36–38% MeOH and 42.5–44.5% MeOH were pooled and used for 20E and E quantification, respectively. (F) Quantity of ecdysteroids in CNS-RG complexes at different developmental times and larval genotypes. The E titer is indicated in light gray, whereas that of 20E is shown in dark gray. Each bar represents mean ± SEM of three independent sample preparations. *, p<0.05; **, p<0.01 from Student’s t-test. †, p<0.05 compared to the amount of E in late feeding control larvae (ANOVA with Tukey’s post-hoc test). (G) Quantity of ecdysteroids in the hemolymph at different developmental times and larval genotypes. The E titer is indicated in light gray, whereas that of 20E is shown in dark gray. Each bar represents mean ± SEM of three independent sample preparations.
Figure 2
Figure 2. Regulatory Components of Secretory Vesicle Exocytosis Are Required in the PG for Normal Developmental Progression
(A) Schematic illustration of components involved in calcium-regulated vesicle exocytosis in the PG cells. An unknown GPCR is shown in pink, SNARE complex proteins are shown as green ovals, and E is depicted as purple filled circles. (B) Knockdown of the regulatory components for secretory vesicle exocytosis in the PG causes polyphasic growth arrest. Percentages of developmentally arrested larvae for each genotype are shown. Percentages of larvae arrested at first or second instar (L1/L2) are indicated in light gray, whereas those arrested at third instar (L3) are shown in dark gray. E feeding is indicated by + E. Numbers of animals tested are shown on top of each bar. Insets are representative images of wandering control larvae (control, phm22> or phm22>dicer2) and RNAi larvae arrested as L3 (RNAi). Scale bars, 1 mm. (C) Knockdown of the regulatory components for secretory vesicle exocytosis in the PG causes developmental delay. Developmental time to pupation among non-arrested larvae is shown. Data are represented as mean ± SEM of 3–7 independent experiments. Insets are images of control pupae (control, phm22> or phm22>dicer2), RNAi pupae (RNAi) and RNAi pupae rescued by E feeding (RNAi + E). Scale bars, 1 mm. (D) GCaMP5 calcium imaging of the PG cells from wandering third instar phm22>GCaMP5 larvae. Cumulative maximum intensity projection of a 5-min time-lapse imaging is shown. Colored circles indicate the regions of interest (ROIs) where macro calcium spikes were observed. Scale bar, 25 µm. (E) Plot of mean signal intensity in the cells indicated in (D). The color of each plot corresponds to that of the ROIs in (D). Inset is an example plot of a micro spike from a different sample. (F) Quantification of the PGs that presented either macro (dark gray) or micro (light gray) calcium spikes in the animals of different genotypes (control, phm22>GCaMP5; RNAi, phm22>GCaMP5, RNAi). Numbers of animals observed are shown on top of each genotype. **, p<0.01; ***, p<0.001 from Fisher's exact test compared to control. See also Figure S2 and Movie S1.
Figure 3
Figure 3. Syt-GFP Reveals the Presence of Vesicle-Like Structures in the PG
(A) Representative image of the PG from a wandering control larva overexpressing Syt-GFP (phm22>Syt-GFP). The PG is surrounded by a dashed line. Scale bar, 100 µm. (B) Representative image of the PG from a day 7 (~150 h AEL) IP3R RNAi larva overexpressing Syt-GFP (phm22>Syt-GFP, IP3R RNAi, dicer2). The PG is surrounded by a dashed line. Scale bar, 100 µm. (C) Confocal image of the PG from a wandering control larva overexpressing Syt-GFP. Scale bar, 10 µm. (D) Confocal image of the PG from a day 7 (~150 h AEL) IP3R RNAi larva overexpressing Syt-GFP. Scale bar, 10 µm. (E) Magnified view of the PG cells from day7 (~150 h AEL) IP3R RNAi larvae overexpressing Syt-GPF. Note aggregation of many small vesicle-like structures along the membrane (arrowheads). Scale bars, 10 µm.
Figure 4
Figure 4. Atet Is Expressed in the PG and Required for Normal Developmental Progression
(A) Atet is highly expressed in the PG, as shown by in situ hybridization of the CNS-RG complex from a wandering larva with an Atet antisense probe. The PG components of the RG are indicated by arrows, and the CNS is surrounded by a dashed line. Scale bar, 100 µm. (B) Atet-knockdown in the PG causes polyphasic growth arrest. Percentages of developmentally arrested larvae for each genotype are shown. Percentages of larvae arrested at first or second instar (L1/L2) are indicated in light gray, whereas those arrested at third instar (L3) are shown in dark gray. E feeding is indicated by + E. Numbers of animals tested are shown on top of each bar. Inset is a representative image of a wandering control larva (control, phm22>) and an Atet RNAi larvae arrested as L3 (RNAi, phm22>Atet RNAi). Scale bar, 1 mm. (C) Atet-knockdown in the PG causes developmental delay. Developmental time to pupation among nonarrested larvae is shown. Data are represented as mean ± SEM of 3–7 independent experiments. (D) Atet-knockdown in the PG leads to the formation of overgrown pupae. Representative image of a control pupa (control; phm22>), an Atet-knockdown pupa (RNAi, phm22>Atet RNAi) and an Atet-knockdown pupa rescued by E feeding (RNAi + E, phm22>Atet RNAi with E feeding). Scale bar, 1 mm. (E) Syt1 and Atet co-localize in the PG. Representative confocal image of the PG from a wandering larva overexpressing Syt-GFP (green) and YPet-Atet (magenta). The square area surrounded by a dashed line in the left panel is magnified on the right. Vesicles labeled by both Syt-GFP and YPet-Atet are indicated by arrowheads. Scale bar, 10 µm. See also Figure S3.
Figure 5
Figure 5. Atet Is An E Transporter
(A) Membrane topology of a normal ABC-type transporter (left) and of Atet (right) as predicted by membrane topology prediction servers. White boxes indicate the ATP bind cassette (ABC). (B) Anti-HA staining of S2 cells overexpressing N-terminally-tagged Atet (HA-Atet) or C-terminally-tagged E23 (E23-HA) in permeabilized and non-permeabilized conditions. The C-terminus of E23 was consistently predicted by prediction servers (Phobius, TMHMM and HMMTOP) to be intracellular and therefore used as a negative control. (C) E transporting activity of Atet and E23 measured by modified vesicular transport assay. Data are represented as mean ± SEM of 5–6 independent experiments. **, p<0.01 compared to control (0% transport) from Student’s t-test. See also Figure S4 for the details of the modified vesicular transport assay.
Figure 6
Figure 6. Schematic Illustration of the Vesicle-Mediated E Release Model
Torso is shown in red, an unknown GPCR is shown in pink, and Atet is shown in orange. E is depicted as purple filled circles. ER, endoplasmic reticulum; M, mitochondria.

References

    1. Akerboom J, Chen TW, Wardill TJ, Tian L, Marvin JS, Mutlu S, Calderón NC, Esposti F, Borghuis BG, Sun XR, et al. Optimization of a GCaMP calcium indicator for neural activity imaging. J Neurosci. 2000;32:13819–13840. - PMC - PubMed
    1. Andrews HK, Zhang YQ, Trotta N, Broadie K. Drosophila sec10 is required for hormone secretion but not general exocytosis or neurotransmission. Traffic. 2002;3:906–921. - PubMed
    1. Aravamudan B, Fergestad T, Davis WS, Rodesch CK, Broadie K. Drosophila UNC-13 is essential for synaptic transmission. Nat Neurosci. 1999;2:965–971. - PubMed
    1. Birkenbeil H. Ultrastructural and immunocytochemical investigation of ecdysteroid secretion by the prothoracic gland of the waxmoth Galleria mellonella. Cell Tissue Res. 1983;229:433–441. - PubMed
    1. Birkenbeil H, Eckert M, Gersch M. Electron microscopical-immunocytochemical evidence of ecdysteroids in the prothoracic gland of Galleria mellonella. Cell Tissue Res. 1979;200:285–290. - PubMed

Publication types

MeSH terms