. 2015 Dec;3(12):e758-66.
doi: 10.1016/S2214-109X(15)00162-X. Epub 2015 Nov 4.

Optimum population-level use of artemisinin combination therapies: a modelling study

Affiliations

Optimum population-level use of artemisinin combination therapies: a modelling study

Tran Dang Nguyen et al. Lancet Glob Health. 2015 Dec.

Abstract

Background: Artemisinin combination therapies (ACTs) are used worldwide as first-line treatment against confirmed or suspected Plasmodium falciparum malaria. Despite the success of ACTs at reducing the global burden of malaria, emerging resistance to artemisinin threatens these gains. Countering onset of resistance might need deliberate tactics aimed at slowing the reduction in ACT effectiveness. We assessed optimum use of ACTs at the population level, specifically focusing on a strategy of multiple first-line therapies (MFT), and comparing it with strategies of cycling or sequential use of single first-line ACTs.

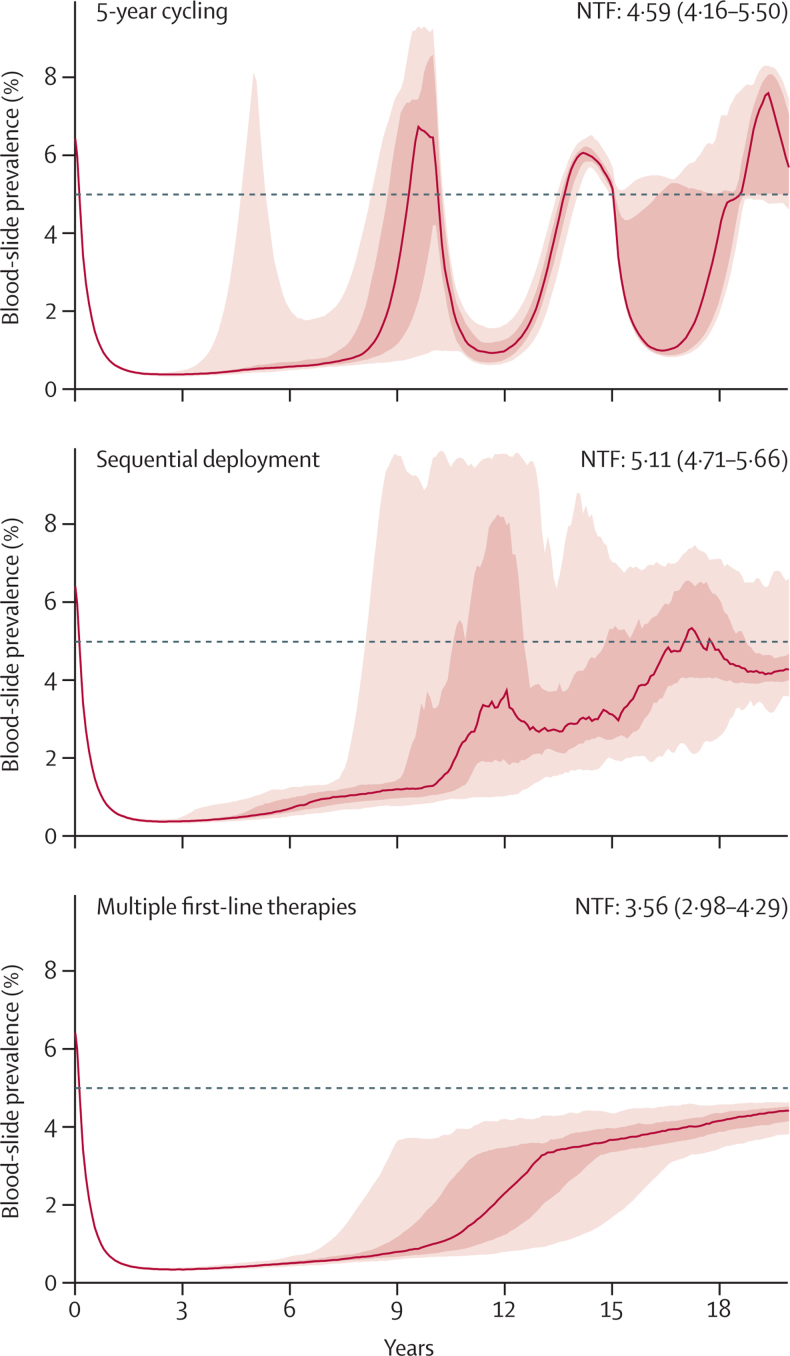
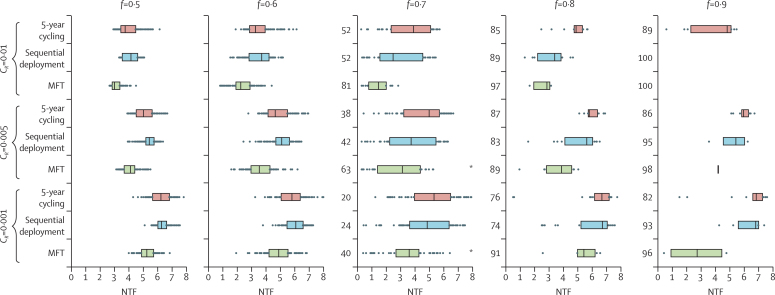
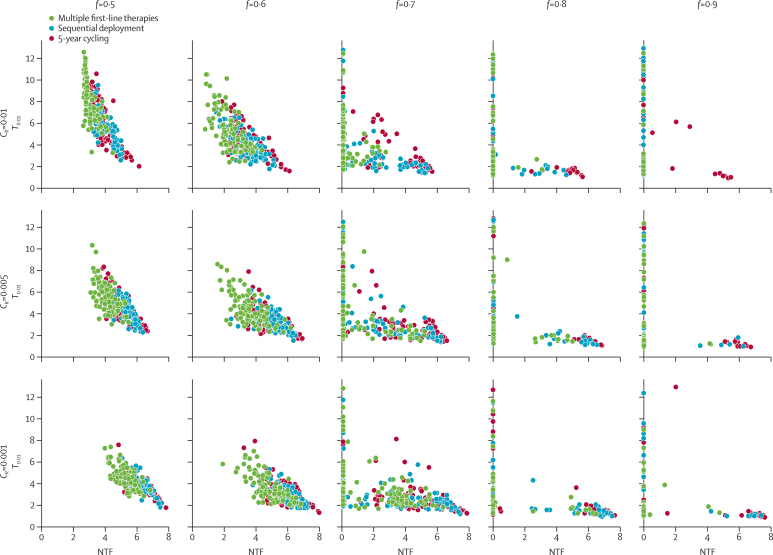
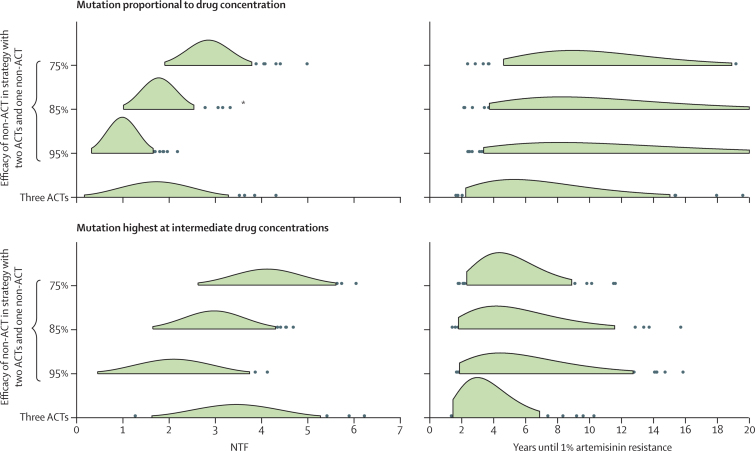
Methods: With an individual-based microsimulation of regional malaria transmission, we looked at how to apply a therapy as widely as possible without accelerating reduction of efficacy by drug resistance. We compared simultaneous distribution of artemether-lumefantrine, artesunate-amodiaquine, and dihydroartemisinin-piperaquine (ie, MFT) against strategies in which these ACTs would be cycled or used sequentially, either on a fixed schedule or when population-level efficacy reaches the WHO threshold of 10% treatment failure. The main assessment criterion was total number of treatment failures per 100 people per year. Additionally, we analysed the benefits of including a single non-ACT therapy in an MFT strategy, and did sensitivity analyses in which we varied transmission setting, treatment coverage, partner-drug half-life, fitness cost of drug resistance, and the relation between drug concentration and resistance evolution.

Findings: Use of MFT was predicted to reduce the long-term number of treatment failures compared with strategies in which a single first-line ACT is recommended. This result was robust to various epidemiological, pharmacological, and evolutionary features of malaria transmission. Inclusion of a single non-ACT therapy in an MFT strategy would have substantial benefits in reduction of pressure on artemisinin resistance evolution, delaying its emergence and slowing its spread.

Interpretation: Adjusting national antimalarial treatment guidelines to encourage simultaneous use of MFT is likely to extend the useful therapeutic life of available antimalarial drugs, resulting in long-term beneficial outcomes for patients.

Funding: Wellcome Trust, UK Medical Research Council, Li Ka Shing Foundation.


Figures

Figure 1
Figure 1
Expected patterns of drug-resistance evolution and corresponding malaria prevalence for three treatment regimens We ran 100 stochastic simulations in a population of 1 million individuals, in a low-transmission setting (entomological inoculation rate=1·3) with 60% treatment coverage and an assumed cost of resistance of 0·5% for resistant genotypes. The mutation rate is assumed to be highest for intermediate drug concentrations. The red line shows the median prevalence across 100 simulations, and the red regions show the IQR and 90% range. The median number of treatment failures (NTF) with IQRs are shown in each panel (p<0·0001 when comparing multiple first-line therapies to the other two strategies). The dashed line shows 5% prevalence. For the cycling and sequential strategies, after emergence of a novel drug-resistant type, an epidemiological rebound sometimes causes prevalence to reach higher-than-expected levels (here, >6%) for short periods.
Figure 2
Figure 2
Median number of treatment failures (NTFs) for different strategies, different costs of resistance (CR), and different treatment coverages (f) Each row shows the NTF results of 100 model simulations with bars spanning the IQR. NTF values are lower for multiple first-line therapies than for cycling or sequential strategies; all p<0·0001, except for the comparisons *, for which p=0·01. For f≥0·7, the NTF distributions have a bimodal shape, with NTF<0·5 corresponding to simulations that achieved extinction or near-extinction; the numbers on the left-hand side of each boxplot show the counts of these extinctions or near-extinctions, and the IQRs are plotted only for simulations that did not result in extinction. Simulations assume that three artemisinin combination therapies with 95% efficacy are used in a low-transmission setting with an entomological inoculation rate of 1·3. Drug resistance mutations have their highest probability of fixation at intermediate drug concentrations.
Figure 3
Figure 3
Number of treatment failures (NTF) plotted against the time taken to reach an average of 1% resistance frequency in the population Variance in time-to-emergence is greater for MFT strategies than for cycling or sequential strategies, resulting in a subset of simulations with long emergence times.
Figure 4
Figure 4
Comparisons of artemisinin monotherapy use for multiple first-line therapies (MFT), 5-year cycling, and sequential deployment Artemisinin monotherapy use values are shown for different costs of resistance (cR), and different treatment coverages (f). Each row shows the artemisinin monotherapy results of 100 model simulations, with bars spanning the IQR. Artemisinin monotherapy use values are lower for MFT (all p=0·001) except for the comparisons corresponding to *. Simulations assume that three artemisinin combination therapies with 95% efficacy are used in a low-transmission setting (entomological inoculation rate=1·3). Partner-drug resistance mutations have their highest probability of fixation at intermediate drug concentrations. Artemisinin monotherapy use decreases with treatment coverage because prevalence is lower when more individuals are treated.
Figure 5
Figure 5
Comparison with a non-artemisinin combination therapy (ACT) drug included in a multiple first-line therapies (MFT) strategy Comparisons between MFT strategies with three ACT components and MFT strategies in which one of the components in the treatment strategy is not an artemisinin-based therapy. Results of 100 simulations for each strategy are summarised as normal distributions for the number of treatment failures (NTF; shown in green out to ±2σ), and as gamma distributions for the time until frequency of artemisinin resistance reaches 1% (central 90% of distribution shown in green). Distributions of NTF and the time until 1% artemisinin resistance for three ACTs are significantly different (p=0·01) from the comparator distributions in which one non-ACT is used, except for the comparison labelled *, for which there was no difference. The upper panels use a mutation model in which mutation rate is proportional to drug concentration. The lower panels show simulation results when the mutation rate increases at intermediate concentrations. Simulations assume that three ACTs with 95% efficacy are used in a low-transmission setting (entomological inoculation rate=1·3). In the simulations with two ACTs, the shorter half-life ACTs were used (minimising selection pressure), and the non-ACT therapy is assumed to be a combination therapy with components that have 7-day and 10-day half-lives. Treatment coverage is f=0·6.

Comment in

  • Saving lives through improved use of ACTs.
    Jagoe G, Amuasi JH. Jagoe G, et al. Lancet Glob Health. 2015 Dec;3(12):e727-8. doi: 10.1016/S2214-109X(15)00208-9. Epub 2015 Nov 4. Lancet Glob Health. 2015. PMID: 26545448 No abstract available.

References

    1. Feachem RG, Phillips AA, Hwang J. Shrinking the malaria map: progress and prospects. Lancet. 2010;376:1566–1578. - PMC - PubMed
    1. Moonen B, Cohen JM, Snow RW. Operational strategies to achieve and maintain malaria elimination. Lancet. 2010;376:1592–1603. - PMC - PubMed
    1. Maude RJ, Pontavornpinyo W, Saralamba S. The last man standing is the most resistant: eliminating artemisinin-resistant malaria in Cambodia. Malar J. 2009;8:31. - PMC - PubMed
    1. WHO . Guidelines for the treatment of malaria. 1st edn. World Health Organization; Geneva: 2006.
    1. White NJ. Qinghaosu (artemisinin): the price of success. Science. 2008;320:330–334. - PubMed

Publication types

MeSH terms