. 2016 Feb;33(2):591-3.
doi: 10.1093/molbev/msv255. Epub 2015 Nov 5.

Computationally Efficient Composite Likelihood Statistics for Demographic Inference

Affiliations

Computationally Efficient Composite Likelihood Statistics for Demographic Inference

Alec J Coffman et al. Mol Biol Evol. 2016 Feb.

Abstract

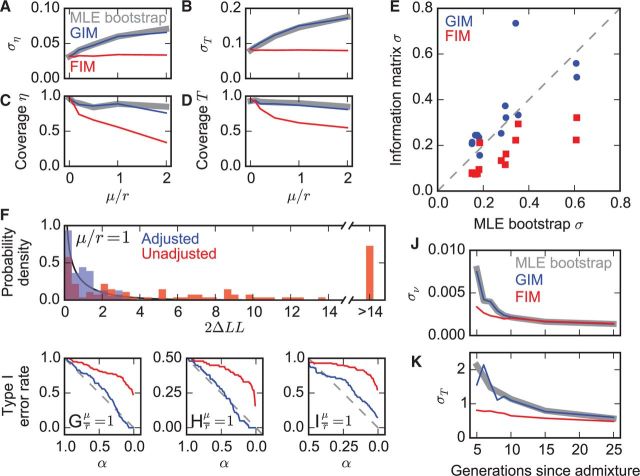
Many population genetics tools employ composite likelihoods, because fully modeling genomic linkage is challenging. But traditional approaches to estimating parameter uncertainties and performing model selection require full likelihoods, so these tools have relied on computationally expensive maximum-likelihood estimation (MLE) on bootstrapped data. Here, we demonstrate that statistical theory can be applied to adjust composite likelihoods and perform robust computationally efficient statistical inference in two demographic inference tools: ∂a∂i and TRACTS. On both simulated and real data, the adjustments perform comparably to MLE bootstrapping while using orders of magnitude less computational time.

Keywords: composite likelihood; demographic inference; likelihood ratio test; parameter uncertainties.


Figures

F<sc>ig</sc>. 1.
Fig. 1.
Adjusted composite-likelihood statistics compared with MLE on bootstrapped data and assuming full likelihood. Throughout, results in gray are from MLE on bootstrapped data, in blue are from composite likelihood (GIM), and in red are from assuming full likelihood (FIM). The full likelihood assumption is incorrect when data are linked (μ/r ≠ 0). (A, B) Inferred ai parameter standard deviations for data simulated with an instantaneous population size change η at a time T in the past. To vary the strength of linkage, the mutation rate μ was held constant while the recombination rate r was varied. Plotted are averages over 100 data sets per value of μ/r. (C, D) Coverage of 95% confidence intervals for model and simulations in (A) and (B). (E) Parameter standard deviations from Godambe and Fisher Information Matrices compared with conventional bootstrapping for the data and 13-parameter ai model of Gutenkunst et al. (2009). (F) For 100 symmetric migration data sets simulated with linkage, log-likelihood differences (ΔLL) between asymmetric and symmetric migration ai models, before (red) and after adjustment (blue) compared with expected χ12 null distribution (black line). (G) Type I error rate versus significance level α for LRT on simulations and models in F, using adjusted (blue) and nonadjusted (red) ΔLLs. (H) Type I error rate versus significance level α for LRT between ai models of isolation with and without migration. (I) Type I error rate versus significance level α for LRT between instantaneous growth and standard neutral ai models. (J, K) Standard deviations for parameters inferred by TRACTS for a model in which Europeans and African-Americans admixed T generations ago with admixture proportion ν and 1 − ν.

References

    1. Bhaskar A, Wang YR, Song Y. 2015. Efficient inference of population size histories and locus-specific mutation rates from large-sample genomic variation data. Genome Res. 25:268–279. - PMC - PubMed
    1. Catelan M, Sartori N. 2015. Empirical and simulated adjustments of composite likelihood ratio statistics. J Stat Comput Simul.
    1. Efron B, Hinkley DV. 1978. Assessing the accuracy of the maximum likelihood estimator: observed versus expected Fisher information. Biometrika 65(3):457–483.
    1. Excoffier L, Dupanloup I, Huerta-Sánchez E, Sousa VC, Foll M. 2013. Robust demographic inference from genomic and SNP data. PLoS Genet. 9(10):e1003905. - PMC - PubMed
    1. Fearnhead P, Yu S, Biggs P, Holland B, French N. 2015. Estimating the relative rate of recombination to mutation in bacteria from single-locus variants using composite likelihood methods. Ann Appl Stat. 9(1):200–224.

Publication types

LinkOut - more resources