. 2015 Nov 17;43(5):884-95.
doi: 10.1016/j.immuni.2015.10.002. Epub 2015 Nov 3.

Activation-Induced Cytidine Deaminase Expression in Human B Cell Precursors Is Essential for Central B Cell Tolerance

Affiliations

Activation-Induced Cytidine Deaminase Expression in Human B Cell Precursors Is Essential for Central B Cell Tolerance

Tineke Cantaert et al. Immunity. .

Abstract

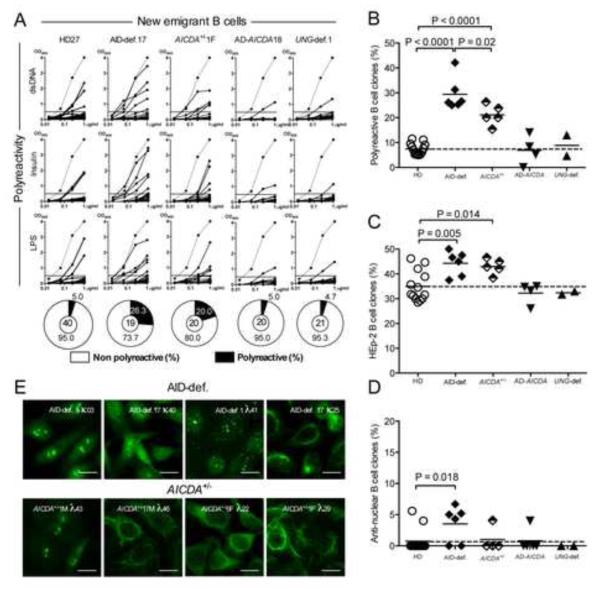
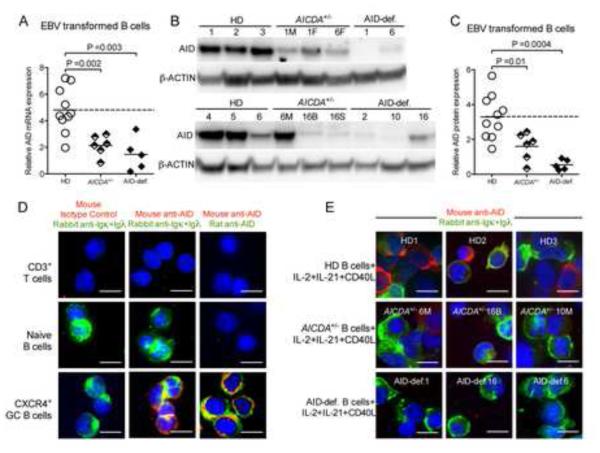
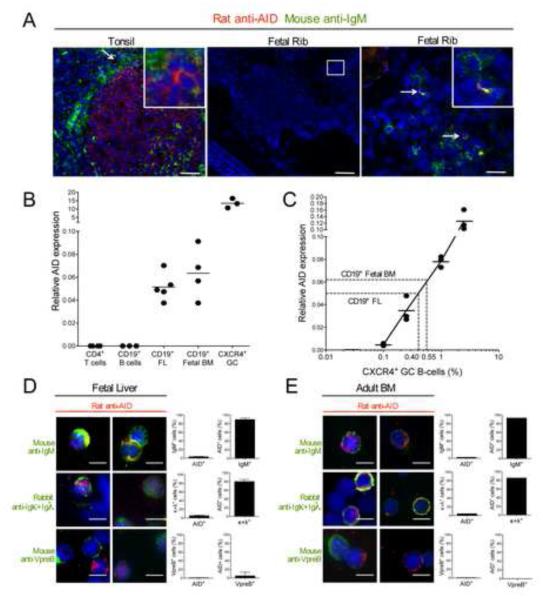
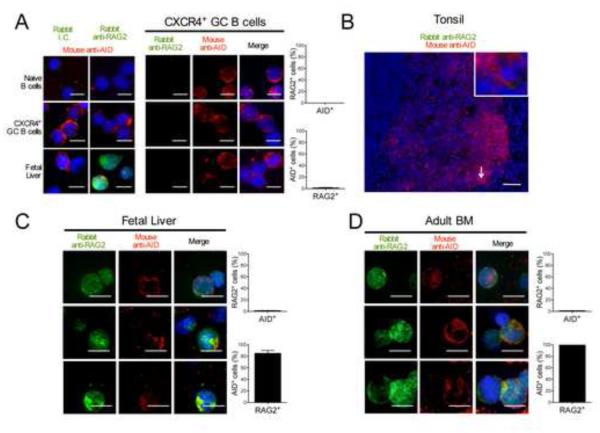
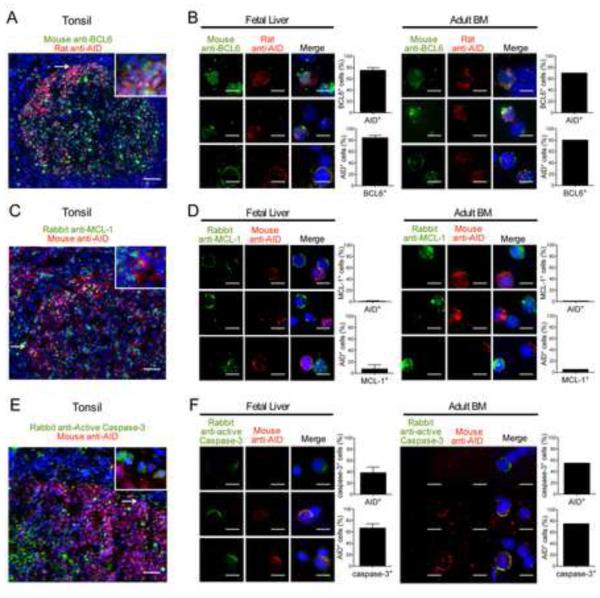
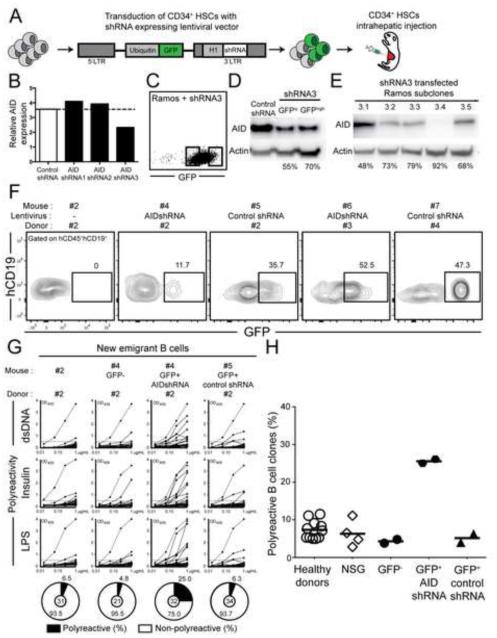
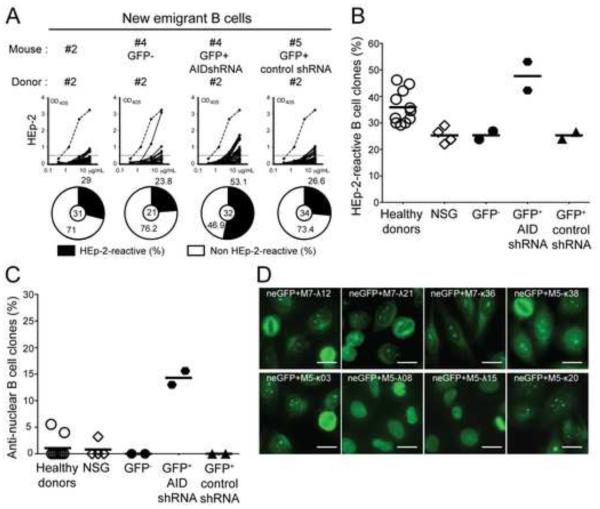
Activation-induced cytidine deaminase (AID), the enzyme-mediating class-switch recombination (CSR) and somatic hypermutation (SHM) of immunoglobulin genes, is essential for the removal of developing autoreactive B cells. How AID mediates central B cell tolerance remains unknown. We report that AID enzymes were produced in a discrete population of immature B cells that expressed recombination-activating gene 2 (RAG2), suggesting that they undergo secondary recombination to edit autoreactive antibodies. However, most AID+ immature B cells lacked anti-apoptotic MCL-1 and were deleted by apoptosis. AID inhibition using lentiviral-encoded short hairpin (sh)RNA in B cells developing in humanized mice resulted in a failure to remove autoreactive clones. Hence, B cell intrinsic AID expression mediates central B cell tolerance potentially through its RAG-coupled genotoxic activity in self-reactive immature B cells.

Keywords: AID-deficient patients; B cell development; B cell tolerance; activation-induced cytidine deaminase.


Figures

Figure 1
Figure 1. AID gene dosage dependent regulation of central B-cell tolerance
(A) Antibodies from new emigrant B cells from healthy donors (HD, n=12), AID-deficient (AID-def.) patients (n=6), asymptomatic healthy heterozygotes (AICDA+/−, n=5), patients with autosomal dominant (AD) AICDA mutation (n=4) and UNG-deficient (UNG-def.) patients (n=2) were tested by ELISA for reactivity against double-stranded DNA (dsDNA), insulin and lipopolysaccharide (LPS). Antibodies were considered polyreactive when they recognized all 3 analyzed antigens. Dotted lines show ED38-positive control. Horizontal lines show cut-off OD405 for positive reactivity. For each individual, the frequency of autoreactive (filled area) and non autoreactive (open area) clones is summarized in pie charts, with the total number of clones tested indicated in the centers. The frequencies of polyreactive (B), HEp-2 reactive (C) and anti-nuclear (D) new emigrant B cells is summarized. Lines show the mean, dashed line indicates the mean value for the healthy donors (HD). (E) Autoreactive antibodies from AID-def. and asymptomatic healthy AICDA+/− heterozygotes new emigrant B cells show various patterns of HEp-2 staining. Original magnification 40X, scale bar: 10 μm. Please see Figure S2.
Figure 2
Figure 2. Decreased AID expression in asymptomatic healthy individuals carrying one mutated AICDA allele
(A) Quantitative real-time PCR show decreased transcript of AICDA mRNA in EBV-transformed B cell lines from AICDA+/− asymptomatic healthy heterozygotes (n=6), AID-def. patients (n=5) and healthy donors (HD) (n=10). Transcripts were normalized to HPRT1. (B) Immunoblot analysis of total protein lysates from EBV-transformed B cell lines from healthy donors (HD), asymptomatic healthy heterozygotes (AICDA+/−), and AID-def. patients. Immunoblotting against β-Actin was used as loading control. Quantification is summarized in C. (D) Cytospin slides of sorted CD3+ T cells, CD19+IgD+CD38CXCR4 B cells and CD19+IgDCD38+CXCR4+ GC B cells were stained for Igκ/Igλ and mouse anti-AID or concentration matched isotype control. (e) cytospin slides of CD20+ B cells isolated from healthy donor (HD), AICDA+/− or AID-def. patients stimulated with CD40L+IL-2+IL-21 were stained for Igκ/Igλ (green) and mouse anti-AID (red). AID expression is detected in GC but not in naive B or T cells and not in AID-deficient B cells stimulated with cytokines that induce AID expression in AID competent B cells. Original magnification 40X, scale bar: 10 μm. Data is representative of 2 independent experiments for (B), (D) and (E).
Figure 3
Figure 3. AID is expressed in immature B cells
(A) Tonsil and fetal rib (115 day old) sections were stained for AID (red) and IgM (green). Higher magnification (right panel) reveals presence of IgM+AID+ cells in fetal rib. Data is representative of 3 independent fetal rib samples and 1 tonsil sample. scale bar (left to right): 50, 200 and 25 μm. (B) Quantitative real-time PCR shows presence of AICDA mRNA transcript in CD34CD19+ fetal liver (FL) and fetal BM samples. Transcripts were normalized to HPRT1. (C) 0.1-2.5% of sorted CD19+IgDCD38+CXCR4+ GC B cells were spiked in peripheral mature naive CD19+ B cells and AICDA mRNA transcript was measured. A relative AICDA expression of 0.05-0.06 in FL and fetal BM as measured in B corresponds to 0.40-0.55% of CXCR4+ GC B cells. (D, E) Cytospin slides of CD34CD19+ purified fetal liver or adult bone marrow (BM) cells were stained for IgM, Igκ+Igλ or VpreB (green) and AID (red) and quantified for co-staining. AID protein is expressed in 0.9% ± 0.4 of total CD34 CD19+ cells. Data are representative of 3 fetal liver and 1 adult bone marrow sample(s). Error bars represent mean ± SD. Original magnification 40X, scale bar: 10 μm.
Figure 4
Figure 4. AID is co-expressed with RAG2 in early immature B cells
Cytospin slides of sorted CD19+IgD+CD38CXCR4 naïve B cells, CD19+IgDCD38+CXCR4+ GC B cells and CD34CD19+ fetal liver B cell precursors were stained for RAG2 or concentration matched isotype control (green) and AID (red) and co-staining was quantified. Data is representative of 2 independent experiments. Original magnification 40X, scale bar: 10 μm (B) Tonsil tissue sections stained for AID (red) and RAG2 (green) showed no RAG2 staining. Data is representative of 1 tonsil sample. Original magnification 20X, scale bar: 50 μm (C, D) Cytospin slides of CD34CD19+ purified fetal liver or adult bone marrow cells were stained for RAG2 (green) and AID (red) and co-staining was quantified. Most AID+ B cells co-express RAG2. Data are representative of 3 fetal liver and 1 adult bone marrow sample(s). Error bars represent mean ± SD. Original magnification 40X, scale bar: 10 μm.
Figure 5
Figure 5. AID+ cells are undergoing apoptosis
Tonsil tissue section (A) or cytospin slides of CD34CD19+ purified fetal liver or adult bone marrow (BM) (B) were stained for BCL6 (green) and AID (red) and co-staining was quantified. Most AID+ cells co-express BCL6. Tissue section of tonsil (C) or cytospin slides of CD34CD19+ purified fetal liver or adult BM (D) were stained for MCL-1 (green) and AID (red) and co-staining was quantified. The vast majority of AID+ cells do not express anti-apoptotic MCL-1. Tissue section of tonsil (E) or cytospin slides of CD34CD19+ purified fetal liver or adult BM (F) were stained for active caspase-3 (green) and AID (red) and co-staining was quantified. AID and activated caspase-3 co-staining reveals that many AID+ cells fail to be rescued from cell death by apoptosis. Data are representative of 3 fetal liver, 1 adult bone marrow, and 1 tonsil sample(s). Error bars represent mean ± SD. scale bar: 50 μm (A, C, E) and 10 μm (B, D, F). Please see also Figure S3.
Figure 6
Figure 6. Inhibition of AID expression during B cell development interferes with the removal of polyreactive clones
(A) Schematic diagram depicting the generation of humanized mice. CD34+ hematopoietic stem cells (HSCs) were transduced with lentiviruses allowing the expression of AID or control shRNA before being injected in the liver of 3 day-old recipient NOD.Cg-Prkdcscid Il2rgtm1Wjl/SzJ mice (B) Relative expression of AICDA in Ramos cells transfected with control shRNA, or 3 different shRNAs targeting human AICDA cDNA sequence. Values are normalized to HPRT1. Data shows the mean of 3 independent experiments. (C) Transfection efficiency and sorting strategy for Ramos cells transfected with GFP-tagged AID shRNA3. (D) AID protein expression in Ramos cells transfected with control shRNA or AID shRNA3 after sorting GFPlo or GFPhi expressing cells. Protein expression of β-actin is used for normalization. Percentage of knock-down is indicated. Data is representative of 2 independent experiments. (E) AID protein expression in subclones of Ramos transfected cells with shRNA3. Protein expression of β-actin is used for normalization. Percentage of gene silencing is indicated. Data is representative of 2 independent experiments (F) Transduction efficiency and sorting strategy of the GFP+ shRNA+ fractions in hCD45+hCD19+ B cells. (G) B-cell intrinsic AID expression is required for central B-cell tolerance. Antibodies from new emigrant B cells isolated from control humanized mice and sorted GFP as well as GFP+ fractions expressing AID shRNA or control shRNA were tested by ELISA for reactivity against dsDNA, insulin and LPS. Polyreactive antibodies reacted against all 3 antigens. Dotted lines show ED38-positive control. Horizontal lines show cutoff OD405 for positive reactivity. For each mouse, the frequency of polyreactive and non-polyreactive clones is summarized in pie charts, with the number of antibodies tested indicated in the center. The frequencies of polyreactive new emigrant B cells in healthy donors and humanized mice expressing or not the indicated shRNA are summarized in (H). Each symbol represents an individual or mouse, and the horizontal bars show the average. Please see Figure S4.
Figure 7
Figure 7. Central B-cell tolerance requires B-cell intrinsic AID expression
(A) Antibodies from new emigrant B cells isolated from control humanized mice and sorted GFP as well as GFP+ fractions expressing AID shRNA or control shRNA were tested by ELISA for reactivity against HEp-2 cell lysate. Solid lines show binding for each cloned recombinant antibody. Dotted lines show ED38-positive control. Horizontal lines show cutoff OD405 for positive reactivity. For each mouse, the frequency of HEp-2 reactive and non HEp-2 reactive B cells are summarized in pie charts, with the number of antibodies tested shown in the center. The frequencies of HEp-2 reactive (B) and anti-nuclear (C) new emigrant B cells are compared between healthy donors and humanized mice expressing or not the indicated shRNA. Each symbol represents an individual or mouse, and the horizontal bars show the average. (D) Anti-nuclear antibodies expressed by new emigrant B cells expressing AID shRNA show various chromatin reactive and non-reactive nuclear reactvity. Original magnification, ×40. scale bar: 10 μm . Please see Figure S4.

References

    1. Basso K, Dalla-Favera R. Roles of BCL6 in normal and transformed germinal center B cells. Immunological reviews. 2012;247:172–183. - PubMed
    1. Burrows PD, Stephan RP, Wang YH, Lassoued K, Zhang Z, Cooper MD. The transient expression of pre-B cell receptors governs B cell development. Seminars in immunology. 2002;14:343–349. - PubMed
    1. Crouch EE, Li Z, Takizawa M, Fichtner-Feigl S, Gourzi P, Montano C, Feigenbaum L, Wilson P, Janz S, Papavasiliou FN, Casellas R. Regulation of AID expression in the immune response. The Journal of experimental medicine. 2007;204:1145–1156. - PMC - PubMed
    1. Di Noia JM, Neuberger MS. Molecular mechanisms of antibody somatic hypermutation. Annual review of biochemistry. 2007;76:1–22. - PubMed
    1. Duy C, Yu JJ, Nahar R, Swaminathan S, Kweon SM, Polo JM, Valls E, Klemm L, Shojaee S, Cerchietti L, et al. BCL6 is critical for the development of a diverse primary B cell repertoire. The Journal of experimental medicine. 2010;207:1209–1221. - PMC - PubMed

Publication types

MeSH terms