. 2016 Jan 1;291(1):334-41.
doi: 10.1074/jbc.M115.685289. Epub 2015 Nov 6.

Cooperative Binding of Stromal Interaction Molecule 1 (STIM1) to the N and C Termini of Calcium Release-activated Calcium Modulator 1 (Orai1)

Affiliations

Cooperative Binding of Stromal Interaction Molecule 1 (STIM1) to the N and C Termini of Calcium Release-activated Calcium Modulator 1 (Orai1)

Raz Palty et al. J Biol Chem. .

Abstract

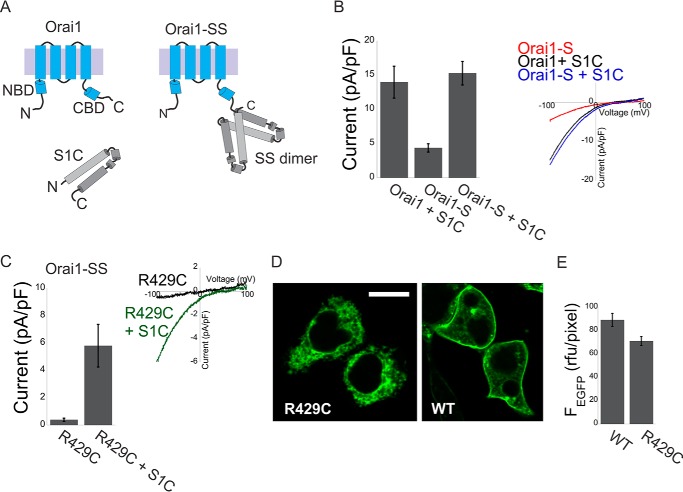
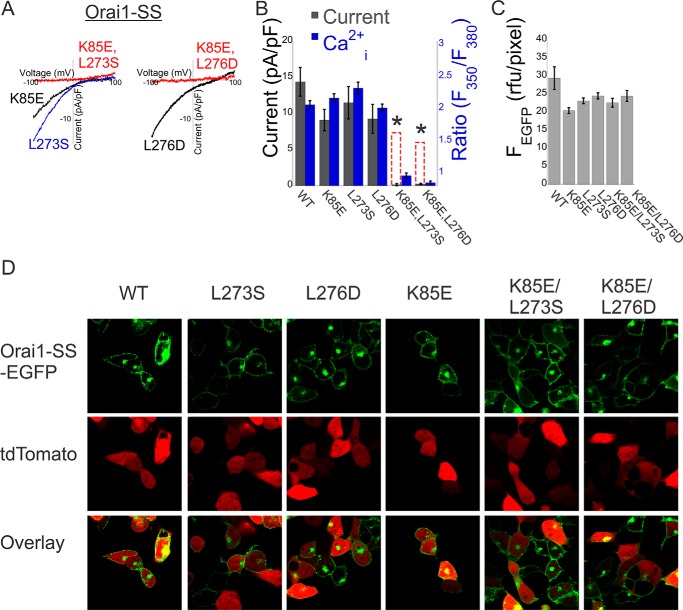
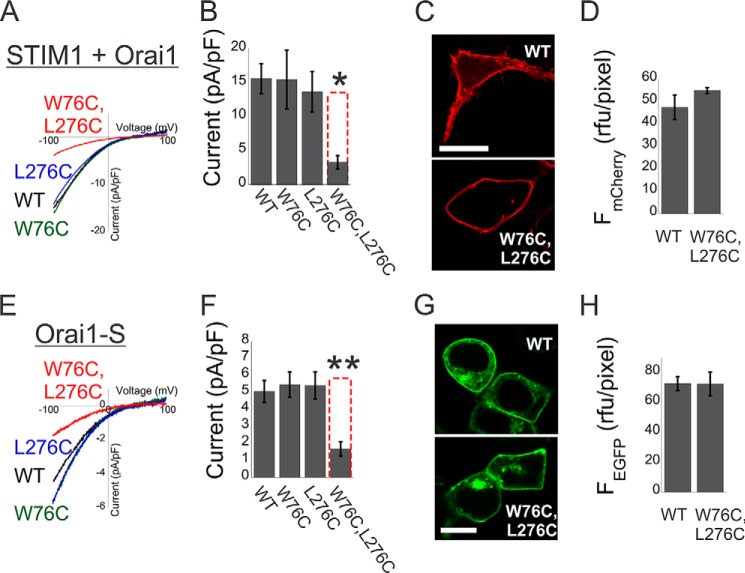
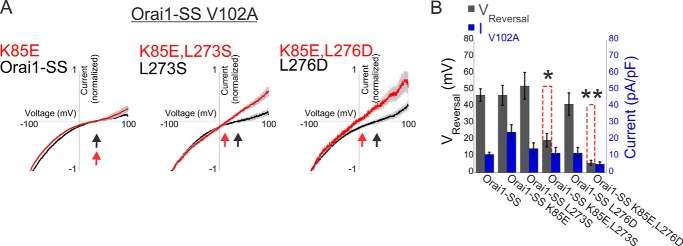
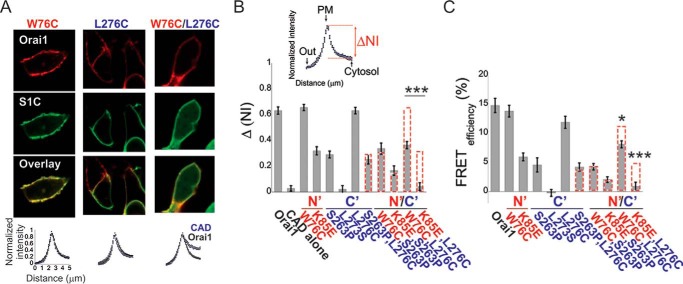
Calcium flux through store-operated calcium entry is a central regulator of intracellular calcium signaling. The two key components of the store-operated calcium release-activated calcium channel are the Ca(2+)-sensing protein stromal interaction molecule 1 (STIM1) and the channel pore-forming protein Orai1. During store-operated calcium entry activation, calcium depletion from the endoplasmic reticulum triggers a series of conformational changes in STIM1 that unmask a minimal Orai1-activating domain (CRAC activation region (CAD)). To gate Orai1 channels, the exposed STIM1-activating domain binds to two sites in Orai1, one in the N terminus and one in the C terminus. Whether the two sites operate as distinct binding domains or cooperate in CAD binding is unknown. In this study, we show that the N and C-terminal domains of Orai1 synergistically contribute to the interaction with STIM1 and couple STIM1 binding with channel gating and modulation of ion selectivity.

Keywords: calcium channel; calcium release-activated calcium channel protein 1 (ORAI1); gating; ion channel; stromal interaction molecule 1 (STIM1).


Figures

FIGURE 1.
FIGURE 1.
Untethered STIM1 fragments interact with Orai1-S or with the R429C Orai1-SS mutant. A, schematic of Orai1, the SOAR/CAD-like S1C fragment, and the Orai1-SS channels used in this work. B, summary of current densities (n = 5–8 cells, left panel) and representative plots of the current-voltage relationship (right panel) of currents recorded from cells expressing Orai1-S alone or from cells co-expressing S1C together with Orai1 or Orai1-S. pF, picofarad. C, summary of current densities (n = 5 cells, left panel) and representative plots of the current-voltage relationship (right panel) recorded from cells expressing Orai1-SS with the loss-of-function mutation R429C alone or together with WT S1C (left panel). D and E, representative fluorescence images (D) and summary of fluorescence densities (E) measured from cells expressing the WT or the R429C Orai1-SS-EGFP mutant (n = 6 regions in each). rfu, relative fluorescence units. Scale bar = 10 μm.
FIGURE 2.
FIGURE 2.
Cooperative interaction between STIM1 fragments and the N and C termini of Orai1 controls channel activation. A, representative plots of the current-voltage relationship of currents recorded from cells expressing the indicated single or double Orai1-SS mutants. pF, picofarad. B, summary of current densities (n = 5–8 cells) or basal Ca2+ levels (n = 25–35 cells) recorded from cells expressing Orai1-SS with the indicated single or double mutations. Dashed red columns show the predicted additive effect for the double mutants. C and D, quantitation of expression levels for the Orai1 constructs used in this work. C, summary of fluorescence densities measured for the indicated Orai1-SS-EGFP mutants (n = 6 regions in each). D, representative fluorescence images of cells co-expressing the indicated Orai1-SS-EGFP mutant together with td-Tomato (as a marker for the cytosol and nucleus regions). *, p < 0.05.
FIGURE 3.
FIGURE 3.
Cooperative interaction between STIM1 and the N and C termini of Orai1 controls channel activation. A, representative plots of the current-voltage relationship of currents recorded from cells expressing STIM1 with mCherry-Orai1 or with the indicated mCherry-Orai1 mutants. pF, picofarad. B, summary of current densities recorded from cells expressing STIM1 with the indicated single or double mCherry-Orai1 mutations (n = 10–15 cells). C and D, representative fluorescence images (C) and summary of fluorescence densities (D) measured from cells expressing the WT or the W76C/L276C Orai1 double mutant (n = 6 regions in each). E, representative plots of the current-voltage relationship of currents recorded from cells expressing WT Orai1-S or Orai1-S with the indicated Orai1 mutation. F, summary of current densities recorded from cells expressing Orai1-S with the indicated single or double mutations (n = 6–9 cells). G and H, representative fluorescence images (G) and summary of fluorescence densities (H) measured from cells expressing the WT Orai1-S or the W76C/L276C Orai1-S double mutant (n = 6 regions in each). Dashed red columns show the predicted additive effect for the double mutants. Scale bars = 10 μm. *, p < 0.05; **, p < 0.01.
FIGURE 4.
FIGURE 4.
Cooperative interaction between STIM1 fragments and the N and C termini of Orai1 controls regulation of ion selectivity. A, average of normalized plots of the current-voltage relationship recorded in 10 mm Ca2+ Ringer's solution from cells expressing the indicated double or triple Orai1-SS mutants. Arrows indicate the reversal potential in each instance. B, summary of reversal potentials and current densities recorded from cells expressing the indicated Orai1-SS mutants (n = 5–6 cells). Dashed red columns show the predicted additive effect for the double mutants. *, p < 0.05; **, p < 0.01. pF, picofarad.
FIGURE 5.
FIGURE 5.
Cooperative binding of S1C to the N and C termini of Orai1. A and B, representative fluorescence images (top panel) and summary of normalized intensity values (bottom panel) across the plasma membrane and intracellular regions of cells expressing EGFP-S1C together with the indicated mCherry-Orai1 mutants (n = 12–22 cells). B, quantitative summary of EGFP-S1C fraction (ΔNI = NIPM − NICyto, see inset) that is localized to the plasma membrane (PM). C, summary of FRET efficiency values measured in cells expressing EGFP-S1C together with mCherry-Orai1 or with the indicated single or double mCherry-Orai1 mutants (n = 15–35 cells). Dashed red columns show the predicted additive effect for the double mutants. *, p < 0.05; ***, p < 0.001.

References

    1. Park C. Y., Hoover P. J., Mullins F. M., Bachhawat P., Covington E. D., Raunser S., Walz T., Garcia K. C., Dolmetsch R. E., and Lewis R. S. (2009) STIM1 clusters and activates CRAC channels via direct binding of a cytosolic domain to Orai1. Cell 136, 876–890 - PMC - PubMed
    1. Yuan J. P., Zeng W., Dorwart M. R., Choi Y.-J., Worley P. F., and Muallem S. (2009) SOAR and the polybasic STIM1 domains gate and regulate Orai channels. Nat. Cell Biol. 11, 337–343 - PMC - PubMed
    1. Luik R. M., Wang B., Prakriya M., Wu M. M., and Lewis R. S. (2008) Oligomerization of STIM1 couples ER calcium depletion to CRAC channel activation. Nature 454, 538–542 - PMC - PubMed
    1. Zhou Y., Srinivasan P., Razavi S., Seymour S., Meraner P., Gudlur A., Stathopulos P. B., Ikura M., Rao A., and Hogan P. G. (2013) Initial activation of STIM1, the regulator of store-operated calcium entry. Nat. Struct. Mol. Biol. 20, 973–981 - PMC - PubMed
    1. Covington E. D., Wu M. M., and Lewis R. S. (2010) Essential role for the CRAC activation domain in store-dependent oligomerization of STIM1. Mol. Biol. Cell 21, 1897–1907 - PMC - PubMed

Publication types