. 2015 Dec 25;290(52):30697-712.
doi: 10.1074/jbc.M115.679068. Epub 2015 Nov 6.

Untargeted Plasma Metabolomics Identifies Endogenous Metabolite with Drug-like Properties in Chronic Animal Model of Multiple Sclerosis

Affiliations

Untargeted Plasma Metabolomics Identifies Endogenous Metabolite with Drug-like Properties in Chronic Animal Model of Multiple Sclerosis

Laila M Poisson et al. J Biol Chem. .

Abstract

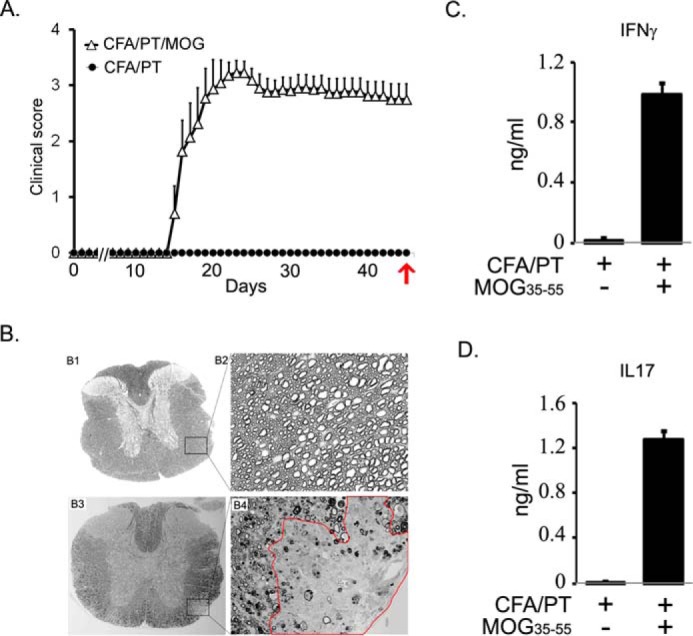
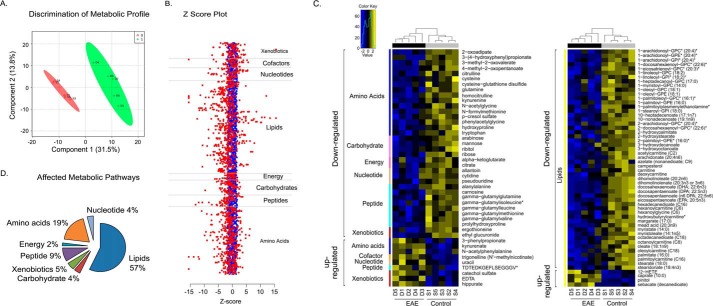
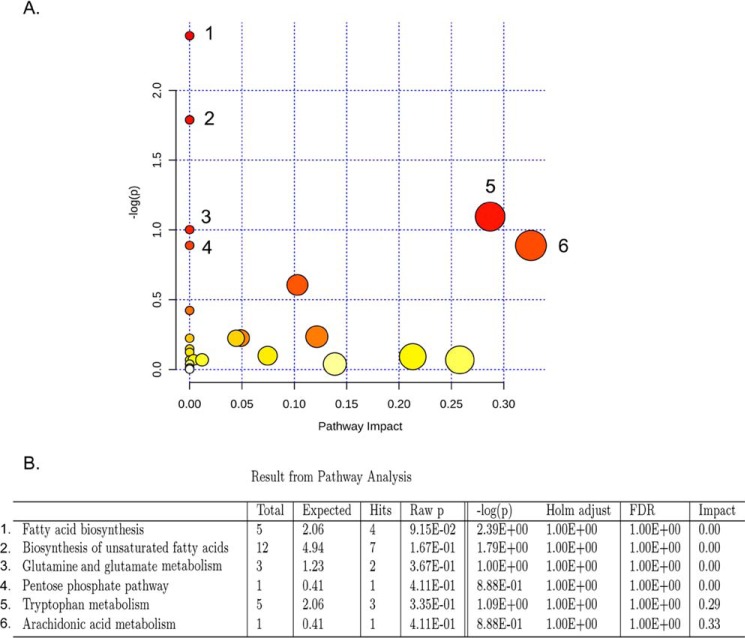
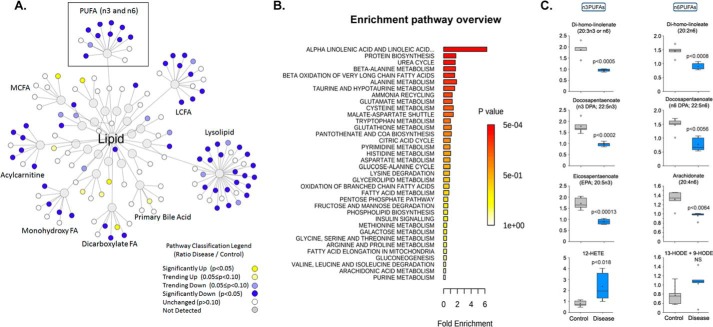
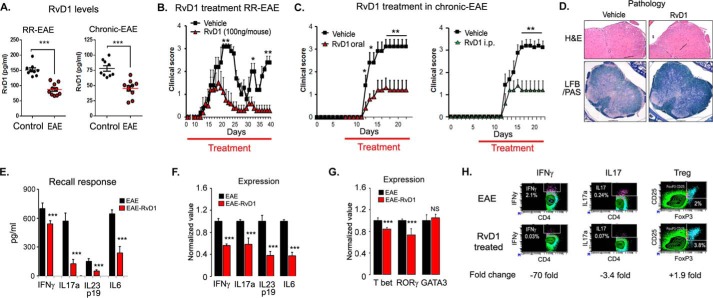
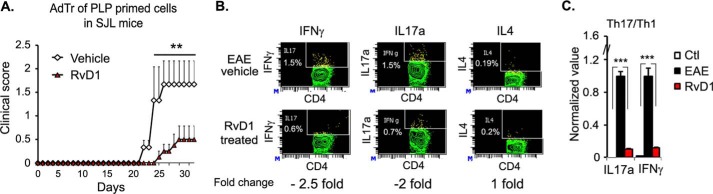
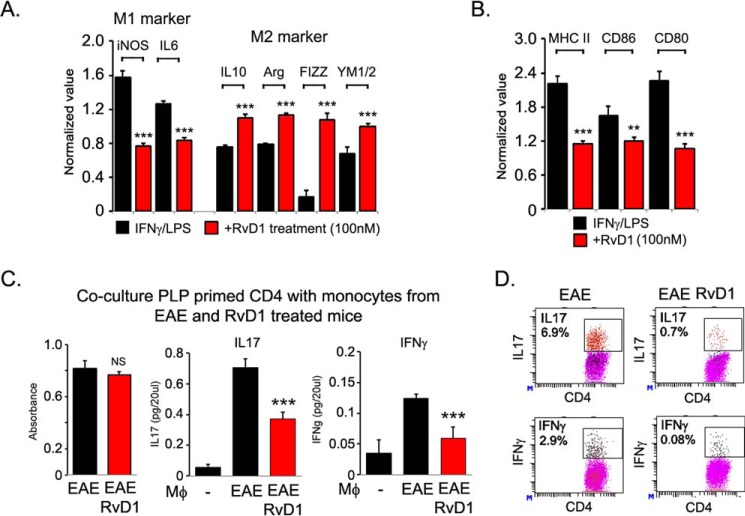
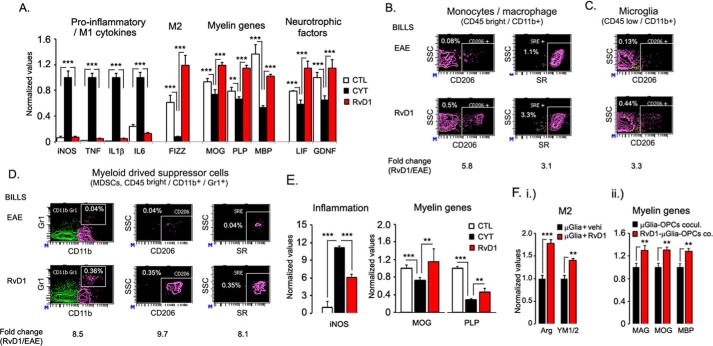
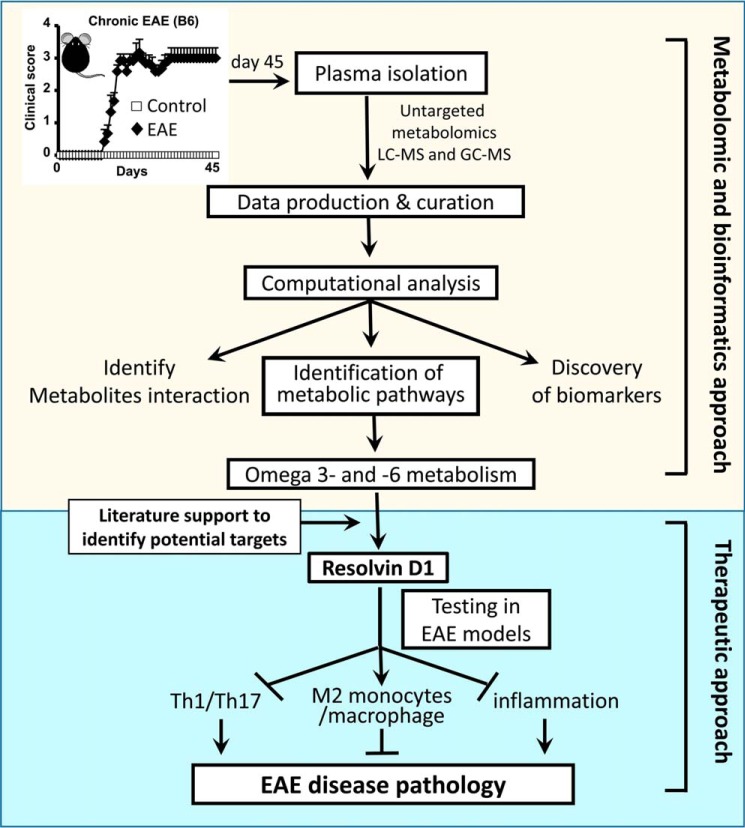
We performed untargeted metabolomics in plasma of B6 mice with experimental autoimmune encephalitis (EAE) at the chronic phase of the disease in search of an altered metabolic pathway(s). Of 324 metabolites measured, 100 metabolites that mapped to various pathways (mainly lipids) linked to mitochondrial function, inflammation, and membrane stability were observed to be significantly altered between EAE and control (p < 0.05, false discovery rate <0.10). Bioinformatics analysis revealed six metabolic pathways being impacted and altered in EAE, including α-linolenic acid and linoleic acid metabolism (PUFA). The metabolites of PUFAs, including ω-3 and ω-6 fatty acids, are commonly decreased in mouse models of multiple sclerosis (MS) and in patients with MS. Daily oral administration of resolvin D1, a downstream metabolite of ω-3, decreased disease progression by suppressing autoreactive T cells and inducing an M2 phenotype of monocytes/macrophages and resident brain microglial cells. This study provides a proof of principle for the application of metabolomics to identify an endogenous metabolite(s) possessing drug-like properties, which is assessed for therapy in preclinical mouse models of MS.

Keywords: autoimmune disease; inflammation; metabolism; metabolomics; multiple sclerosis; neuroinflammation.


Figures

FIGURE 1.
FIGURE 1.
Characterization of clinical pathological state of EAE in chronic mouse model in B6. A, EAE was induced in C57B6 mice using MOG(35–55) peptide emulsified in CFA, and pertussis toxin was given on days 0 and 2 post-immunization. Clinical score was recorded daily (n = 10). The control group was given complete Freund's adjuvant/pertussis toxin without a peptide. On day 45, blood was drawn for analysis of isolated plasma. Red arrow indicates the time of sampling. B, at the end of the experiment, spinal cords were harvested from control (panels B1 and B2) and diseased mice (panels B3 and B4) to examine demyelination. Panels B1 and B3 show the whole mid-thoracic spinal cord section, and panels B2 and B4 show closer images from antero-lateral areas of the white matter. Completely normal and healthy axons can be appreciated on panel B2, and on panel B4 an area with clear demyelination is outlined in red. In addition, in areas that surround the demyelinating lesion, a patchy demyelination, dysmorphic and collapsed axons can be observed, too. C and D, recall response in cells isolated from lymph nodes, stimulated with 50 μg of MOG(35–55) for 72 h. Cell supernatant was used for measuring the levels of IFNγ and IL17 by ELISA (n = 4).
FIGURE 2.
FIGURE 2.
Metabolomics profiling of plasma distinguishes EAE from the control group. A, metabolic profiling reveals clear separation between plasma from EAE (disease; D) and vehicle control mice (sham; S) by partial least squares discrimination analysis. B, z-score plot of EAE metabolite intensities (red, truncated at z-score −15 and +15) against control group metabolites (blue, taken as mean). Each dot represents one metabolite observation for one sample. C, heat map of significantly altered metabolites arranged according to direction of change and the super-metabolic pathway they appear. Yellow represents high, and blue represents the low intensity of the metabolite relative to its mean intensity (black). Each of the five replicates of plasma from vehicle control (S) and EAE (D) are arranged by hierarchical clustering. D, chart representing the number of altered metabolites within each superpathway of metabolism, specifically lipids, amino acids, peptides, xenobiotics, carbohydrates, nucleotides, and energy-related.
FIGURE 3.
FIGURE 3.
Metaboanalyst analysis of altered metabolites in plasma isolated from EAE compared with vehicle controls. A, metaboanalyst analysis of the KEGG metabolic library. Both the over-representation of altered metabolites within the pathway (hypergeometric test) and the impact of the changed metabolites on the function of the pathway through alterations in critical junction points of the pathway (relative betweenness centrality) were assessed. Results of each of the 82 mouse pathways of KEGG are simultaneously plotted to show the most significant pathways in terms of hypergeometric test p value (vertical axis as −log(p), shades of red) and impact (horizontal axis, circle diameter). B, top six pathways that arise with low p values (−log(p) >15) or with “high” impact (impact >0.3).
FIGURE 4.
FIGURE 4.
Visualization of significantly altered lipid pathway changes in EAE. A, lipids found significantly down-regulated in EAE (p < 0.05) are shown as blue nodes, and up-regulated lipids are shown in yellow. Unchanged and undetected lipids are shown as white and gray nodes, respectively. B, metabolite enrichment pathway (Metaboanalyst 3.0) overview highlights PUFAs being significantly enriched in the metabolomic profile of plasma of EAE versus control. C, ω-3 and ω-6 PUFAs are highlighted, and key metabolites in the plasma of vehicle control and EAE groups are presented as a bar graph (n = 5). p < 0.05 is considered significant.
FIGURE 5.
FIGURE 5.
Oral administration of RvD1 attenuates EAE disease progression. A, levels of RvD1 in plasma of RR- and chronic EAE by enzyme immunoassay (n = 9–10). B, SJL mice were immunized with PLP(139–151) on day 0 in complete Freund's adjuvant. One set of the group was given daily RvD1 from day 0 by gavage and another set was given vehicle in the same manner. Red line indicates the duration of treatment. Clinical score was taken until the end of the study (n = 10). C, B6 mice were immunized with MOG(35–55) on day 0 in complete Freund's adjuvant. One set of the group were given daily RvD1 from day 7 by gavage or intraperitoneally, and another set was given vehicle in the same manner. Clinical score was measured daily until end of the study (n = 8). Red line indicates the duration of treatment. D, photographs of spinal cord sections show inflammation (H&E; ×4 magnification) and demyelination (Luxol fast blue-periodic acid-Schiff; LFB/PAS, ×10 magnification) in both groups. Cells were stimulated with phorbol 12-myristate 13-acetate/ionomycin for 4 h in the presence of GolgiPlug. E, spleen cells were harvested and stimulated with PLP(139–151). Post-96 h, cell supernatants were used for ELISA (n = 4). F and G, for quantitative PCR, cells were harvested at 24 h post-stimulation with peptide, and expression of target genes was examined using quantitative PCR after normalizing with ribosomal protein L27 (n = 4). H, at 96 h of peptide stimulation, cells were stimulated with phorbol 12-myristate 13-acetate/ionomycin for 4 h in the presence of GolgiPlug. IL17a-, IFNγ-, and regulatory T cells (CD4+CD25+FoxP3)-expressing cells were measured by intracellular staining on a CD4+ gate. ***, p < 0.001; **, p < 0.01, and *, p < 0.05 compared with EAE.
FIGURE 6.
FIGURE 6.
Oral administration of RvD1 attenuates CNS inflammation. A, spleen cells were isolated from RvD1-treated and -untreated EAE groups and cultured with PLP(139–151). Post-72 h, PLP(139–151) primed T cells were harvested and washed, and 10 million cells were adoptively transferred in a volume of 200 μl via an intraperitoneal route in recipient mice (SJL). Mice were given 300 ng of pertussis toxin at days 0 and 2 and were observed every day for disease onset and disease (n = 4). *, p < 0.05 compared with adoptive transfer of vehicle-treated PLP(139–151)-primed T cells to SJL mice. B, BILs (brain and spinal cord) were isolated using a Percoll gradient as described under “Experimental Procedures.” The percentage of Th1/Th17/Th2 cells in the CD4 subset was analyzed by FACS through intracellular staining of IFNγ and IL17a in BILs isolated from RvD1-treated and -untreated EAE groups on day 22 post-immunization following restimulation with PLP(139–151) peptide for 18 h. C, on day 22 post-immunization, spinal cords were isolated from both groups, and the expression of IFNγ and IL17α was examined using quantitative PCR after normalizing with ribosomal protein L27 (n = 4).
FIGURE 7.
FIGURE 7.
RvD1 induces M2-type phenotype and inhibits class II and co-stimulatory molecular expression in macrophages. A and B, expression of M1- and M2-specific genes, class II and co-stimulatory molecules (CD86 and CD60) were examined in adherent macrophages isolated from spleen cells of RvD1-treated and -untreated EAE groups after panning on a plastic dish and treated with lipopolysaccharide/IFNγ for 6 h (n = 4). C, SJL mice were immunized with PLP(139–151) in complete Freund's adjuvant as described before. Post-10 days, CD4 cells were isolated from spleens/lymph nodes and mixed with adherent monocytes/macrophages isolated from RvD1-treated and -untreated EAE groups at a ratio of 1:5. After 72 h of incubation, cell proliferation was examined using WST-1 reagent (n = 4). Cell supernatant was processed for IFNγ and IL17 analysis by ELISA (BioLegend) (n = 4). NS, not significant; ***, p < 0.001. D, cells were stimulated with phorbol 12-myristate 13-acetate/ionomycin for 4 h in the presence of GolgiPlug. IL17A- and IFNγ-expressing cells were measured by intracellular staining on a CD4+ gate (n = 2).
FIGURE 8.
FIGURE 8.
RvD1 potently attenuates M1 inflammatory markers while increasing the functional M2 marker. A, on day 22 post- immunization, spinal cords were isolated from both groups, and the expression of pro-inflammatory M1 cytokines, M2 gene, myelin genes, and neurotrophic factors was analyzed and normalized against the L27 housekeeping gene using quantitative PCR (n = 4). B, infiltrating mononuclear cells were isolated from RvD1-treated and -untreated groups, and the cellular M2 phenotype (CD206+ and scavenger receptor-positive) was profiled using FACS analysis for activated myeloid cells, including monocytes/macrophages (CD11b+CD45hi); C, resident microglia (CD11b+CD45low) (n = 4). D, infiltrating mononuclear cells were profiled for myeloid-derived suppressor cells (CD45hi CD11b+ Gr1+) and their M2 phenotype (CD206+ and scavenger receptor-positive) using FACS analysis (n = 4). E, rat mixed glial culture was treated with RvD1 (100 nm) for 2 h followed by treatment with pro-inflammatory cytokine combination (TNFα and IFNγ; 20 ng/ml). Post-24 h of incubation, RNA was isolated, and expression of inducible NOS (iNOS) and myelin genes (MOG and PLP) was normalized with L27 as a housekeeping gene (n = 4). F, panel i, primary mouse brain microglial cells were treated with vehicle (0.001% ethanol) or RvD1 (100 nm). Post-24 h of incubation, RNA was isolated, and expression of arginase 1 and chitinase-3-like-3 (YM1/2) was normalized with L27 as a housekeeping gene. F, panel ii, for the coculture study, treated and untreated microglial cells with RvD1 were washed three times with complete culture media, and primary rat oligodendrocyte progenitor cells (OPCs) were cocultured. After 24 h of incubation, cells were processed for expression of myelin genes, including myelin-associated glycoprotein (MAG), myelin oligodendrocyte glycoprotein (MOG), and myelin basic protein (MBP) by quantitative PCR, and data were normalized to the control gene ribosomal L27 housekeeping gene. ***, p < 0.001, and **, p < 0.01.
FIGURE 9.
FIGURE 9.
Schematic flow of implication of untargeted metabolomic approach in EAE.

References

    1. Miller J. R. (2004) The importance of early diagnosis of multiple sclerosis. J. Manag. Care Pharm. 10, S4–S11 - PubMed
    1. Lourenço A. S., Baldeiras I., Grãos M., and Duarte C. B. (2011) Proteomics-based technologies in the discovery of biomarkers for multiple sclerosis in the cerebrospinal fluid. Curr. Mol. Med. 11, 326–349 - PubMed
    1. Zhang A., Sun H., Yan G., Wang P., and Wang X. (2015) Metabolomics for biomarker discovery: moving to the clinic. BioMed Res. Int. 2015, 354671. - PMC - PubMed
    1. Nicholson J. K., and Lindon J. C. (2008) Systems biology: metabonomics. Nature 455, 1054–1056 - PubMed
    1. Zhang A. H., Sun H., and Wang X. J. (2013) Recent advances in metabolomics in neurological disease, and future perspectives. Anal. Bioanal. Chem. 405, 8143–8150 - PubMed

Publication types

Substances