

Benefit, Risk, and Outcomes in Drug Development: A Systematic Review of Sunitinib
- PMID: 26547927
- PMCID: PMC5943825
- DOI: 10.1093/jnci/djv292
Benefit, Risk, and Outcomes in Drug Development: A Systematic Review of Sunitinib
Abstract
Background: Little is known about the total patient burden associated with clinical development and where burdens fall most heavily during a drug development program. Our goal was to quantify the total patient burden/benefit in developing a new drug.
Methods: We measured risk using drug-related adverse events that were grade 3 or higher, benefit by objective response rate, and trial outcomes by whether studies met their primary endpoint with acceptable safety. The differences in risk (death rate) and benefit (overall response rate) between industry and nonindustry trials were analyzed with an inverse-variance weighted fixed effects meta-analysis implemented as a weighted regression analysis. All statistical tests were two-sided.
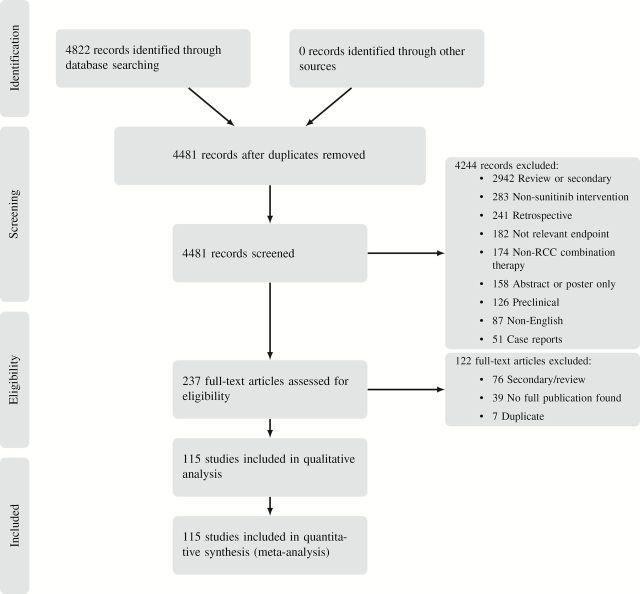
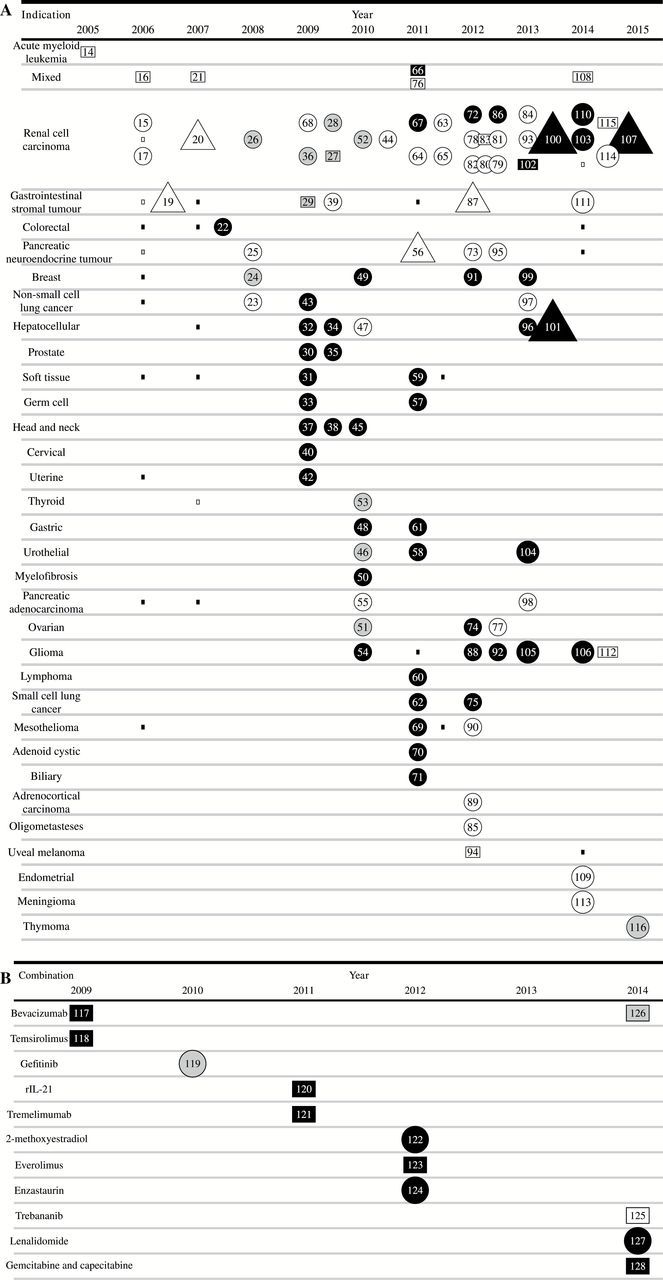
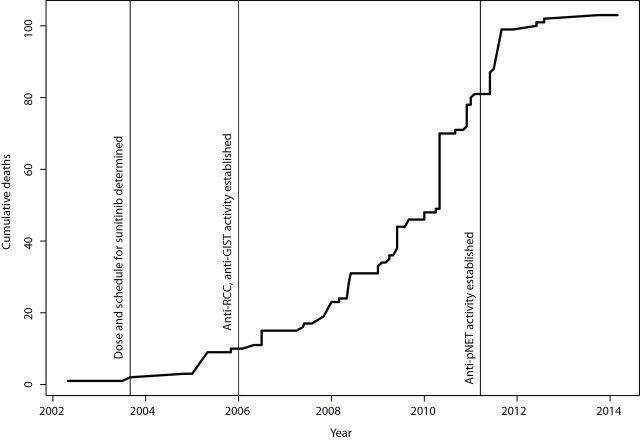
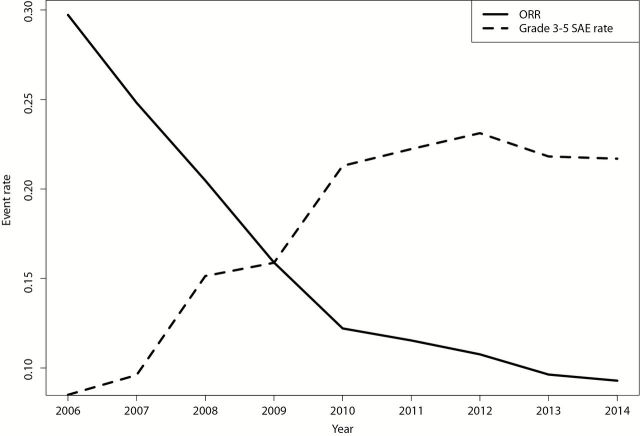
Results: We identified 103 primary publications of sunitinib monotherapy, representing 9092 patients and 3991 patient-years of involvement over 10 years and 32 different malignancies. In total, 1052 patients receiving sunitinib monotherapy experienced objective tumor response (15.7% of intent-to-treat population, 95% confidence interval [CI] = 15.3% to 16.0%), 98 died from drug-related toxicities (1.08%, 95% CI = 1.02% to 1.14%), and at least 1245 experienced grade 3-4 drug-related toxicities (13.7%, 95% CI = 13.3% to 14.1%). Risk/benefit worsened as the development program matured, with several instances of replicated negative studies and almost no positive trials after the first responding malignancies were discovered.
Conclusions: Even for a successful drug, the risk/benefit balance of trials was similar to phase I cancer trials in general. Sunitinib monotherapy development showed worsening risk/benefit, and the testing of new indications responded slowly to evidence that sunitinib monotherapy would not extend to new malignancies. Research decision-making should draw on evidence from whole research programs rather than a narrow band of studies in the same indication.
© The Author 2015. Published by Oxford University Press. All rights reserved. For Permissions, please e-mail: journals.permissions@oup.com.
Figures
References
-
- Chalmers I, Bracken MB, Djulbegovic B, et al. How to increase value and reduce waste when research priorities are set. Lancet. 2014;383(9912):156–165. - PubMed
-
- Contopoulos-Ioannidis DG, Alexiou GA, Gouvias TC, Ioannidis JP. Life cycle of translational research for medical interventions. Science. 2008;321(5894):1298–1299. - PubMed
-
- Moore TJ, Furberg CD. Development times, clinical testing, postmarket follow-up, and safety risks for the new drugs approved by the US Food and Drug Administration: the class of 2008. JAMA Int Med. 2014;174(1):90–95. - PubMed
-
- Kola I, Landis J. Can the pharmaceutical industry reduce attrition rates? Nat Rev Drug Discov. 2004;3(8):711–716. - PubMed
Publication types
MeSH terms
Substances
Grants and funding
LinkOut - more resources
Full Text Sources
Other Literature Sources
Molecular Biology Databases
Miscellaneous
