. 2015 Nov 19;22(11):1470-1479.
doi: 10.1016/j.chembiol.2015.10.004. Epub 2015 Nov 5.

Visualization of Compartmentalized Kinase Activity Dynamics Using Adaptable BimKARs

Affiliations

Visualization of Compartmentalized Kinase Activity Dynamics Using Adaptable BimKARs

Charlene Depry et al. Chem Biol. .

Abstract

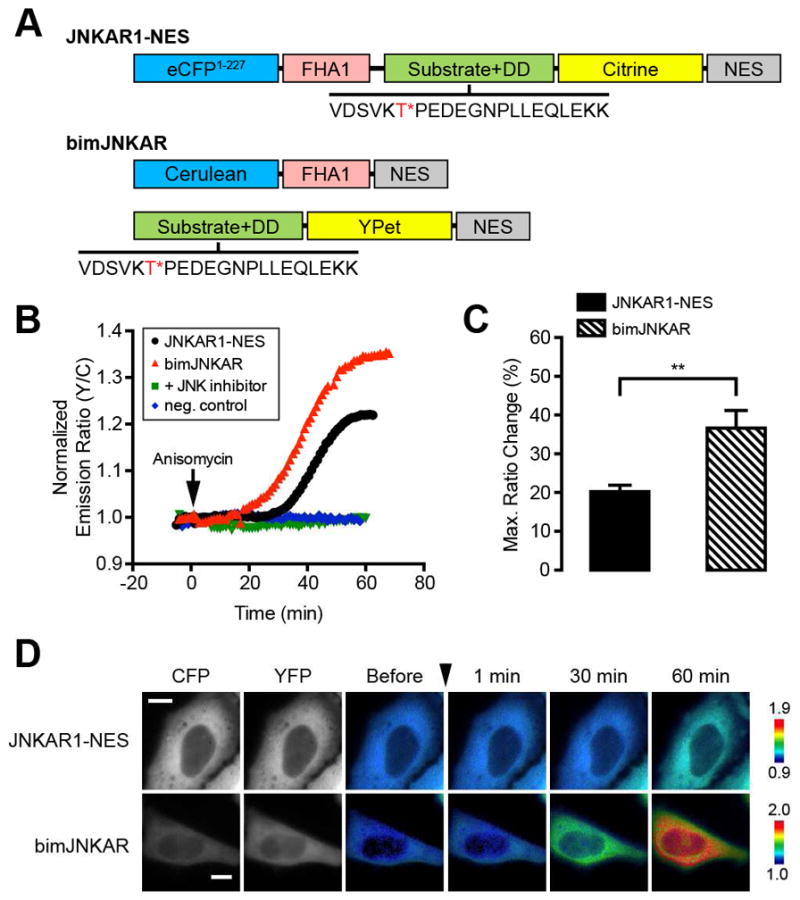
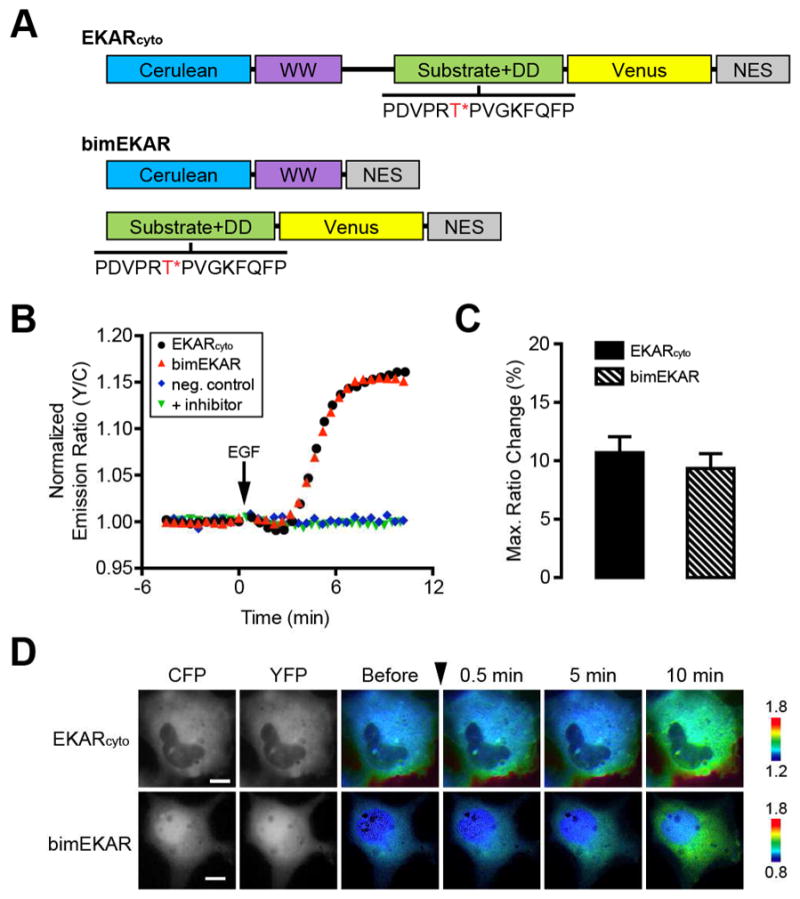
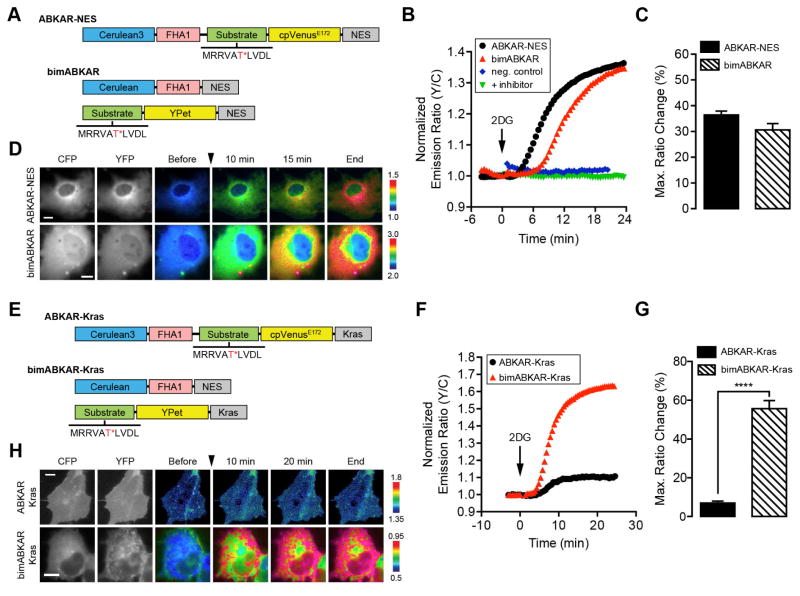
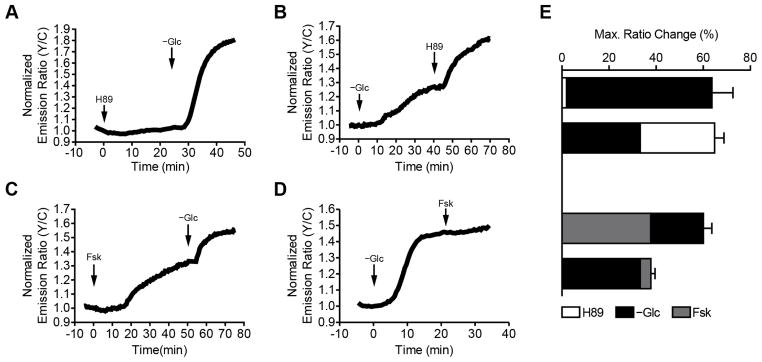
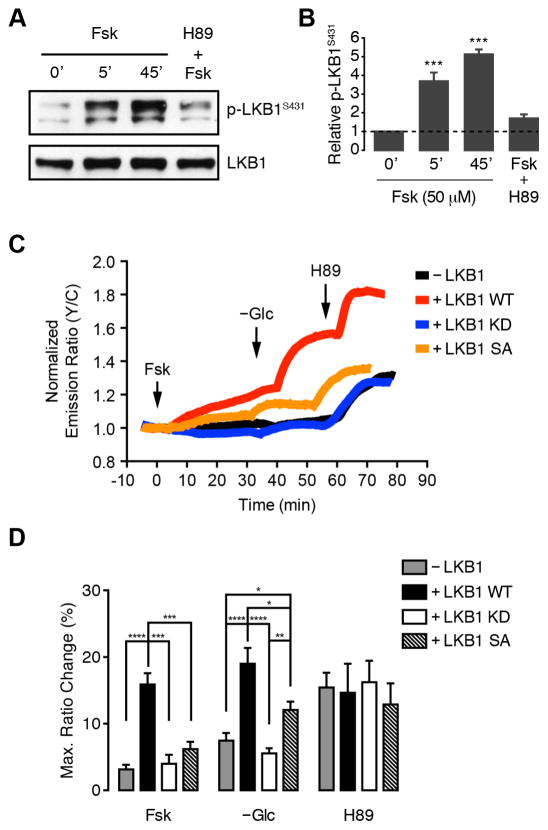
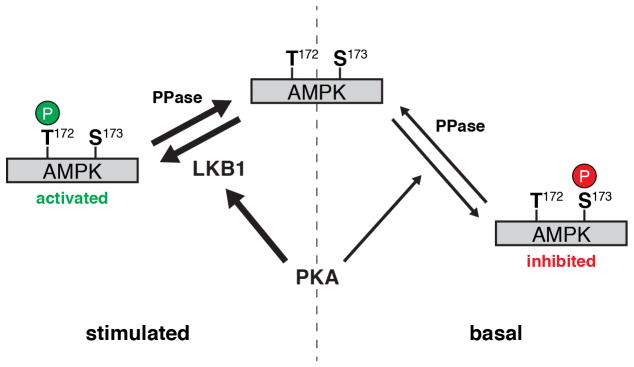
The ability to monitor kinase activity dynamics in live cells greatly aids the study of how signaling events are spatiotemporally regulated. Here, we report on the adaptability of bimolecular kinase activity reporters (bimKARs) as molecular tools to enhance the real-time visualization of kinase activity. We demonstrate that the bimKAR design is truly versatile and can be used to monitor a variety of kinases, including JNK, ERK, and AMPK. Furthermore, bimKARs can have significantly enhanced dynamic ranges over their unimolecular counterparts, allowing the elucidation of previously undetectable kinase activity dynamics. Using these newly designed bimKARs, we investigate the regulation of AMPK by protein kinase A (PKA) in the plasma membrane, and demonstrate that PKA can both negatively and positively regulate AMPK activity in the same cell.

Keywords: AMPK; FRET; PKA; biosensor; compartmentalized signaling; live-cell imaging.


Figures

Figure 1
Figure 1
Development of a bimolecular JNK activity reporter. (A) Schematic diagram of domain structures for unimolecular JNKAR1-NES and bimolecular JNKAR (bimJNKAR). The JNK substrate/docking domain (DD) sequence is shown with the target threonine (T) residue highlighted in red and marked with an asterisk (*). (B) Representative single-cell traces of HeLa cells expressing JNKAR1-NES (black curve), bimJNKAR (red curve), or a non-phosphorylatable bimJNKAR mutant (neg. control; blue curve) treated with 5 μM anisomycin. “+ inhibitor” (green curve) indicates HeLa cells expressing bimJNKAR that were pretreated for 1 h with 20 μM JNK inhibitor VIII. (C) Summary bar graph comparing the average maximum response for JNKAR1-NES and bimJNKAR upon anisomycin treatment. Data shown represent means ± SEM. **, p < 0.01 according to unpaired Student’s t test. (D) Representative pseudocolored images showing the responses of JNKAR1-NES and bimJNKAR to 5 μM anisomycin treatment in HeLa cells. Warmer colors correspond to increasing FRET ratios. Cyan (CFP) and yellow (YFP) fluorescence images show the cellular distribution of probe fluorescence.
Figure 2
Figure 2
Development of a bimolecular ERK activity reporter. (A) Schematic diagram of domain structures for EKARcyto and bimEKAR. The ERK substrate/docking domain (DD) sequence is shown with the target threonine (T) residue highlighted in red and marked with an asterisk (*). (B) Representative single-cell traces of Cos7 cells expressing EKARcyto (black curve), bimEKAR (red curve), or a non-phosphorylatable bimEKAR mutant (neg. control; blue curve) treated with 100 ng/mL EGF. “+ inhibitor” (green curve) indicates Cos7 cells expressing bimEKAR that were pretreated for 1 h with 10 μM U0126. Cells were serum starved for 20 min prior to imaging. (C) Summary bar graphs comparing the average maximum responses of EKARcyto and bimEKAR upon EGF stimulation. Data shown represent means ± SEM. (D) Representative pseudocolored images showing the responses of EKARcyto and bimEKAR to 100 ng/mL EGF treatment in Cos7 cells. Warmer colors correspond to increasing FRET ratios. Cyan (CFP) and yellow (YFP) fluorescence images show the cellular distribution of probe fluorescence.
Figure 3
Figure 3
Development of a biomolecular AMKP activity reporter. (A and E) Schematic diagram of domain structures for (A) ABKAR-NES and bimABKAR or (E) ABKAR-Kras and bimABKAR-Kras. The AMPK substrate sequence is shown with the target threonine (T) residue highlighted in red and marked with an asterisk (*). (B and F) Representative single-cell traces of Cos7 cells expressing (B) ABKAR-NES (black curve), bimABKAR (red curve), or a nonphosphorylatable bimABKAR mutant (neg. control; blue curve) or (F) ABKAR-Kras (black curve) or bimABKAR-Kras (red curve) treated with 40 mM 2DG. The “+ inhibitor” (green curve) in (B) indicates Cos7 cells expressing bimABKAR that were pretreated for 1 h with 20 μM compound C. (C and G) Summary bar graphs comparing the average maximum responses of (C) ABKAR-NES and bimABKAR or (G) ABKAR-Kras and bimABKAR-Kras upon 2DG stimulation. Data shown represent means ± SEM. ***, p < 0.001; ****, p < 0.0001 according to unpaired Student’s t test. (D and H) Representative pseudocolored images showing the responses of (D) ABKAR-NES and bimABKAR or (H) ABKAR-Kras and bimABKAR-Kras to 40 mM 2DG treatment in Cos7 cells. Warmer colors correspond to increasing FRET ratios. Cyan (CFP) and yellow (YFP) fluorescence images show the cellular distribution of probe fluorescence. See also Figure S1.
Figure 4
Figure 4
Bidirectional regulation of AMPK activity by PKA. Representative single-cell traces of bimABKAR-Kras-expressing Cos7 cells treated with (A) 10 μM H89 followed by glucose deprivation (−Glc), (B) glucose deprivation followed by 10 μM H89, (C) 50 μM Fsk stimulation followed by glucose deprivation, or (D) glucose deprivation followed by 50 μM Fsk. (E) Summary bar graphs showing the overall responses of Cos7 cells transfected with bimABKAR-Kras and treated with 10 μM H89 (white), glucose deprivation (−Glc, black), or 50 μM Fsk (grey). Data shown represent means ± SEM. See also Figure S2.
Figure 5
Figure 5
PKA stimulates AMPK activity via LKB1 phosphorylation. (A) Representative western blot showing increase in endogenous LKB1 phosphorylation (p-LKB1S431) relative to total LKB1 levels in Cos7 cells. 0′, untreated; 5′, 50 μM Fsk for 5 min; 45′, 50 μM Fsk for 45 min; H89+Fsk; 10 μM H89 for 10 min followed by 50 μM Fsk for 45 min. (B) Quantification of western blot data from (A). Data shown represent means ± SEM (n = 3). ***, p < 0.001 vs. untreated cells (0′) according to one-way ANOVA followed by Tukey’s multiple comparisons test. (C) Representative single-cell traces showing the FRET ratio change in HeLa cells expressing bimABKAR-Kras alone (−LKB1, black curve) or cotransfected with wild-type LKB1 (LKB1 WT, red curve) kinase-dead LKB1-K781 (LKB1 KD, blue curve), or non-phosphorylatable LKB1-S431A (LKB1 SA, orange curve) and sequentially treated with 50 μM Fsk, glucose deprivation (−Glc), and 10 μM H89 at the indicated times. (D) Bar graph summarizing the maximum individual responses to each treatment shown in (C). Data shown represent means ± SEM. *, p < 0.05; **, p < 0.01; ***, p < 0.001; ****, p < 0.0001 according to unpaired Student’s t test. See also Figure S3.
Figure 6
Figure 6
Model of AMPK regulation by PKA. In resting (i.e., fed) cells, AMPK undergoes rapid basal phosphorylation at Thr172 by activating kinases and weak basal phosphorylation by PKA at inhibitory sites (here represented by Ser173). Whereas Thr172 is rapidly dephosphorylated by cellular phosphatase activity (PPase), inhibitory phosphorylation by PKA is only weakly antagonized, leading to the accumulation of a stable pool of inactivated AMPK. At the same time, however, starvation or PKA stimulation preferentially induces the phosphorylation of LKB1, leading to the robust activation of naïve AMPK via Thr172 phosphorylation.

References

    1. Aoki K, Kumagai Y, Sakurai A, Komatsu N, Fujita Y, Shionyu C, Matsuda M. Stochastic ERK activation induced by noise and cell-to-cell propagation regulates cell density-dependent proliferation. Mol Cell. 2013;52:529–540. - PubMed
    1. Cao J, Meng S, Chang E, Beckwith-Fickas K, Xiong L, Cole RN, Radovick S, Wondisford FE, He L. Low concentrations of metformin suppress glucose production in hepatocytes through AMP-activated protein kinase (AMPK) J Biol Chem. 2014;289:20435–20446. - PMC - PubMed
    1. Chang TJ, Chen WP, Yang C, Lu PH, Liang YC, Su MJ, Lee SC, Chuang LM. Serine-385 phosphorylation of inwardly rectifying K+ channel subunit (Kir6.2) by AMP-dependent protein kinase plays a key role in rosiglitazone-induced closure of the K(ATP) channel and insulin secretion in rats. Diabetologia. 2009;52:1112–1121. - PubMed
    1. Dalby PA, Hoess RH, DeGrado WF. Evolution of binding affinity in a WW domain probed by phage display. Protein Sci. 2000;9:2366–2376. - PMC - PubMed
    1. Depry C, Zhang J. Visualization of kinase activity with FRET-based activity biosensors. Curr Protoc Mol Biol. 2010;Chapter 18(Unit18.15) - PubMed

Publication types

MeSH terms

Substances