. 2015 Nov 19;22(11):1491-1504.
doi: 10.1016/j.chembiol.2015.10.003. Epub 2015 Nov 5.

Small-Molecule Disruption of RAD52 Rings as a Mechanism for Precision Medicine in BRCA-Deficient Cancers

Affiliations

Small-Molecule Disruption of RAD52 Rings as a Mechanism for Precision Medicine in BRCA-Deficient Cancers

Gurushankar Chandramouly et al. Chem Biol. .

Abstract

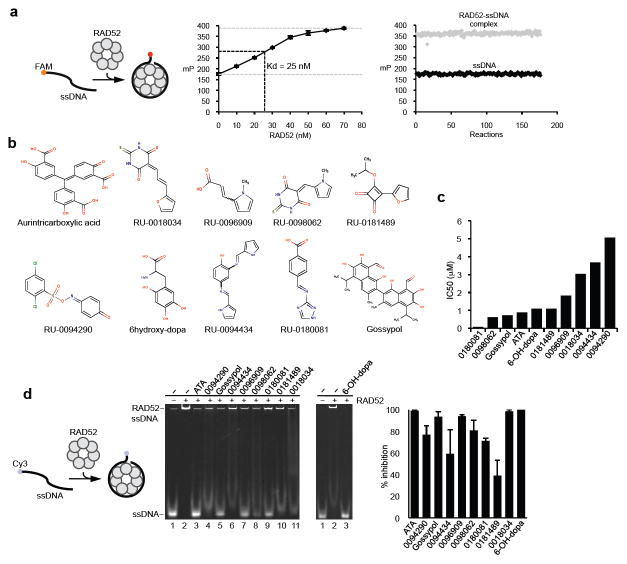
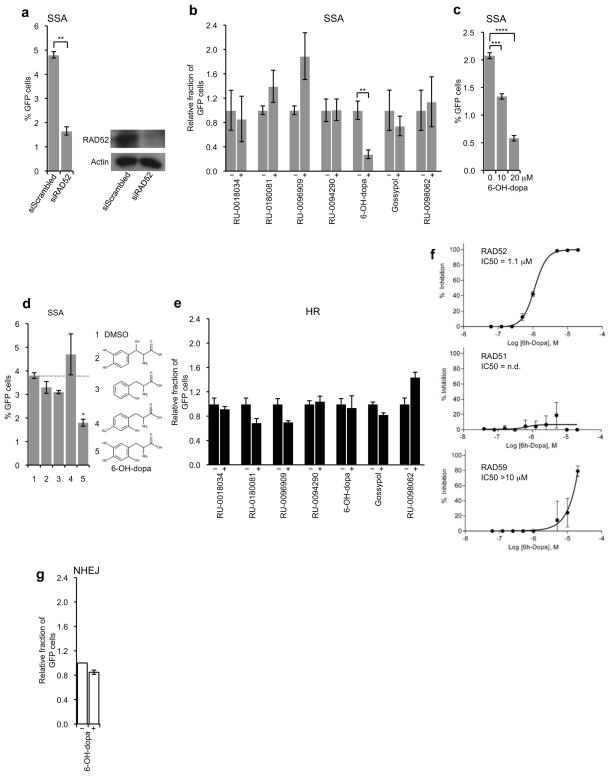
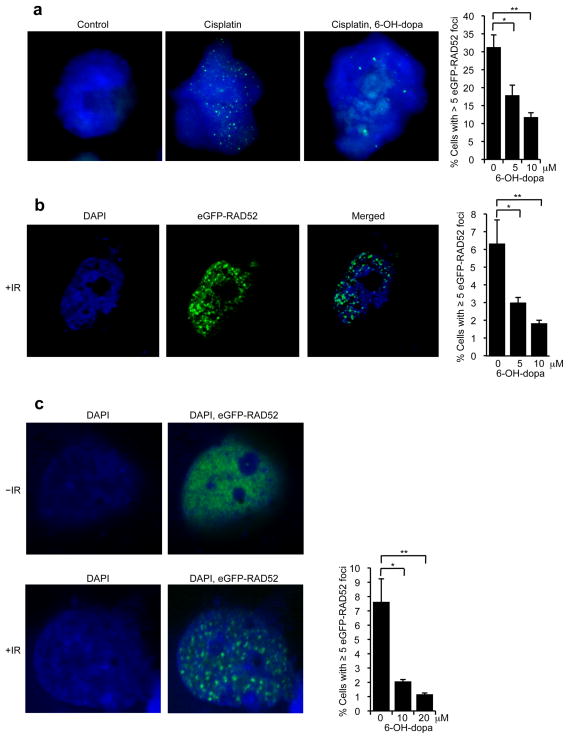
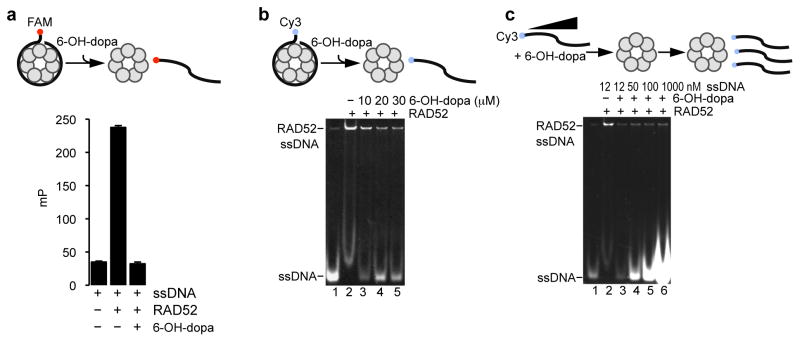
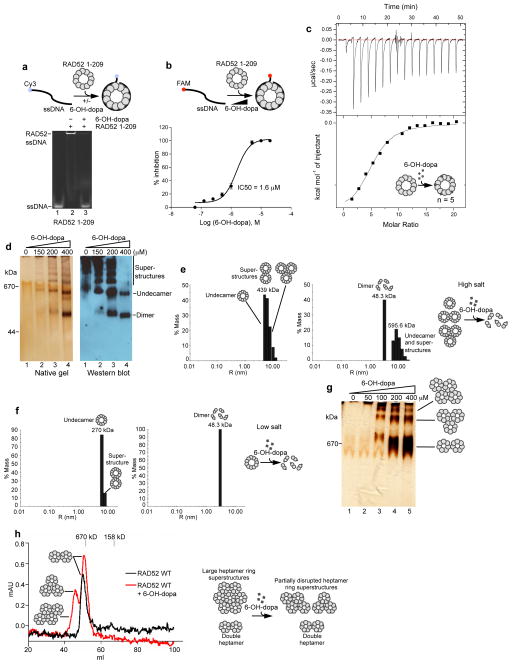
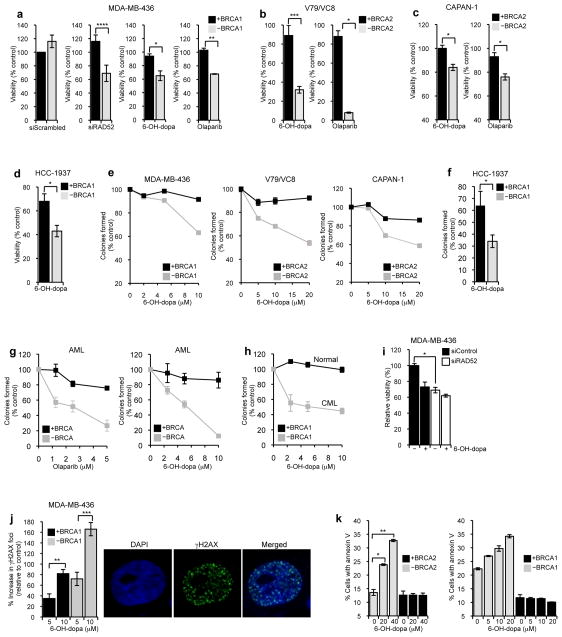
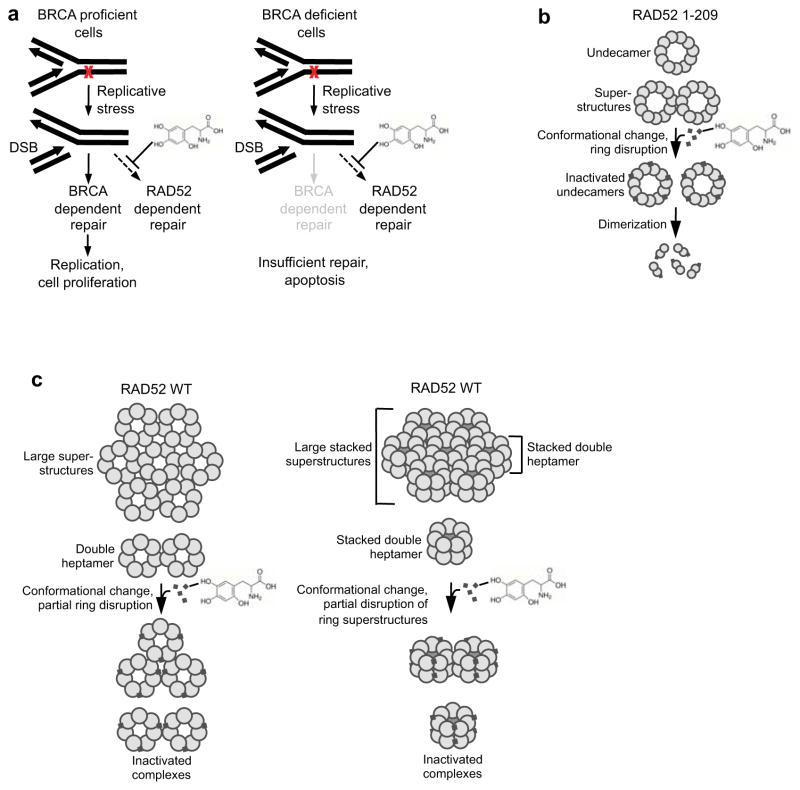
Suppression of RAD52 causes synthetic lethality in BRCA-deficient cells. Yet pharmacological inhibition of RAD52, which binds single-strand DNA (ssDNA) and lacks enzymatic activity, has not been demonstrated. Here, we identify the small molecule 6-hydroxy-DL-dopa (6-OH-dopa) as a major allosteric inhibitor of the RAD52 ssDNA binding domain. For example, we find that multiple small molecules bind to and completely transform RAD52 undecamer rings into dimers, which abolishes the ssDNA binding channel observed in crystal structures. 6-OH-Dopa also disrupts RAD52 heptamer and undecamer ring superstructures, and suppresses RAD52 recruitment and recombination activity in cells with negligible effects on other double-strand break repair pathways. Importantly, we show that 6-OH-dopa selectively inhibits the proliferation of BRCA-deficient cancer cells, including those obtained from leukemia patients. Taken together, these data demonstrate small-molecule disruption of RAD52 rings as a promising mechanism for precision medicine in BRCA-deficient cancers.

Keywords: DNA repair; cancer; cancer therapeutics; genome instability; high-throughput screening; homologous recombination; single-strand annealing; synthetic lethality.


Figures

Figure 1
Figure 1. Identification of RAD52 inhibitors by high-throughput screening
a, Schematic of fluorescence polarization (FP) assay (left). Plot showing RAD52 binding to ssDNA probe. Kd = 25 nM. Data shown as average ± s.d. from 4 independent experiments (middle). Plot showing 176 high signal (RAD52 with ssDNA probe) and 176 low signal (ssDNA probe only) FP control reactions performed in 384-well high-throughput format. Z’ factor = 0.82, mP = millipolarization. b, Structures of select identified RAD52 inhibitors. c, Plot showing IC50 for RAD52 inhibitors. d, Schematic of electrophoresis mobility shift assay (EMSA)(left). Non-denaturing gel of EMSA showing inhibition of RAD52 by 60 μM of indicated small molecules (middle panels). Plot of EMSA data shown as percent inhibition of RAD52. Data shown as average ± s.d. from 3 independent experiments (right).
Figure 2
Figure 2. 6-OH-dopa selectively inhibits RAD52 mediated recombination in vivo
a, Plot showing SSA in U20S cells treated with scrambled and RAD52 siRNA. Data represent mean ± s.e.m from triplicates. **P = 0.00036; two-tailed Student’s t-test (left). Western blots of protein extracts from U20S cells treated with scrambled and RAD52 siRNA (right). b, Plot showing SSA in U20S cells following treatment with 5 μM of the indicated small molecules. Data represent mean ± s.e.m. from 3 separate experiments with triplicates in each experiment. **P = 0.00154; two-tailed Student’s t-test. c, Plot showing SSA in U20S cells following treatment with 0 μM, 10 μM and 20 μM of 6-OH-dopa. Data represent mean ± s.e.m from triplicates. ***P = 0.00039, ****P = 0.00009; two-tailed Student’s t-test. d, Plot showing SSA in U20S cells following treatment with 5 μM of the indicated small molecules. 2 = L-DOPS, 3 = DL-o-tyrosine, 4 = Beta-(2-hydroxy-4-methylphenyl) alanine, 5 = 6-OH-dopa. Data represent mean ± s.e.m from triplicates. *P = 0.00175; two-tailed Student’s t-test. e, Plot showing HR in U20S cells following treatment with 5 μM of the indicated small molecules. Data represent mean ± s.e.m. from 3 separate experiments with triplicates in each experiment. f, Plots showing percent inhibition of indicated protein as a function of 6-OH-dopa concentration. Data shown as average ± s.e.m. from 3 independent experiments. g, Plot showing NHEJ in U20S cells following treatment with or without 5 μM of 6-OH-dopa. Data represent average ± s.e.m. from two separate experiments with triplicates in each experiment.
Figure 3
Figure 3. 6-OH-dopa inhibits RAD52 foci formation
a, Cells stably expressing eGFP-RAD52 were exposed to cisplatin and 6-OH-dopa. Representative images of nuclei counterstained with DAPI (blue) and eGFP-RAD52 (green)(left). Plot showing quantification of cells with eGFP-RAD52 foci following treatment with cisplatin and 6-OH-dopa (right). Data represent mean ± s.e.m from triplicates. *P = 0.01, **P = 0.007; two-tailed Student’s t-test. b, Representative fluorescent images of HEK293T cells visualizing DAPI stain (blue) and eGFP fluorescence (green) following treatment with ionizing radiation (IR)(left). Plot showing percent HEK293T cells with ≥ 5 eGFP-RAD52 foci following treatment with IR and 6-OH-dopa (right). Data shown as average ± s.e.m. from 3 independent experiments. *P = 0.05, **P = 0.03; two-tailed Student’s t-test. c, Representative fluorescent images of MDA-MB-436 BRCA1 complemented cells visualizing DAPI stain (blue) and eGFP RAD52 (green) following treatment with or without ionizing radiation (IR)(left). Plot showing percent MDA-MB-436 BRCA1 complemented cells with ≥ 5 eGFP-RAD52 foci following treatment with IR and 6-OH-dopa (right). Data shown as average ± s.e.m. from 3 independent experiments. *P = 0.03, **P = 0.02; two-tailed Student’s t-test.
Figure 4
Figure 4. 6-OH-dopa dissociates RAD52-ssDNA complexes and acts as a non-competitive inhibitor
a, Schematic of FP assay (top). Plot showing dissociation of RAD52-ssDNA complexes by 30 μM 6-OH-dopa (bottom). Data shown as average ± s.d. from 3 independent experiments. mP = milipolarization. b, Schematic of EMSA (top). Non-denaturing gel showing dissociation of RAD52-ssDNA complexes by 30 μM 6-OH-dopa (bottom). c, Schematic of EMSA (top). Non-denaturing gel showing 6-OH-dopa (25 μM) inhibition of RAD52 in the presence of excess of Cy3-ssDNA substrate (bottom).
Figure 5
Figure 5. 6-OH-dopa targets the RAD52 ssDNA binding domain and disrupts RAD52 rings
a, Schematic of EMSA (top). Non-denaturing gel of EMSA showing 6-OH-dopa inhibition of RAD52 1-209 (bottom). b, Schematic of FP assay (top). Plot showing percent inhibition of RAD52 1-209 ssDNA binding as a function of 6-OH-dopa concentration. IC50 = 1.6 μM. Data shown as average ± s.d. from 3 independent experiments (bottom). c, Plot of isothermal calorimetry (ITC) data showing 6-OH-dopa interaction with RAD52 1-209. Kd = 17.8 μM, n = 5. Model of 6-OH-dopa binding to RAD52 1-209 (inset). d, Silver stained non-denaturing gel of RAD52 1-209 following incubation with 6-OH-dopa (left). Western blot of non-denaturing gel of RAD52 1-209 following incubation with 6-OH-dopa (right). e, Plots showing light scattering data of RAD52 1-209 following incubation with (right panel) and without (left panel) 6-OH-dopa with 1 M NaCl. Model of 6-OH-dopa action on RAD52 1-209 with high salt (right). f, Plots showing light scattering data of RAD52 1-209 following incubation with (right panel) and without (left panel) 6-OH-dopa with 0.15 M NaCl. Model of 6-OH-dopa action on RAD52 1-209 with low salt (right). g, Silver stained non-denaturing gel of RAD52 WT following incubation with 6-OH-dopa (left). h, Gel filtration profiles of RAD52 WT following incubation with (red line) and without (black line) 6-OH-dopa (left). Model of 6-OH-dopa action on RAD52 WT (right).
Figure 6
Figure 6. 6-OH-dopa selectively inhibits the growth of BRCA deficient cells
a-d, Plots showing relative viability of BRCA proficient (black) and deficient (grey) cells following treatment with 20 μM (a), 75 μM (b), 10 μM (c), 5 μM (d) 6-OH-dopa, 20 μM olaparib (c), or indicated siRNA. Data shown as average ± s.e.m. from triplicates a: ****P = 0.0008, *P = 0.02, **P = 0.005, b: ***P = 0.0002, *P = 0.03, c: *P = 0.01, *P = 0.01, d: *P = 0.05; two-tailed Student’s t-test. e-h, Plots showing clonogenic survival of indicated BRCA proficient and deficient cells following treatments with 6-OH-dopa or olaparib. Data shown as average ± s.e.m. from 3 independent experiments. Data points in (g,h) represent 3 different patient cells pooled together. f: *P = 0.03; two-tailed Student’s t-test. i, Plots showing viability of BRCA1 deficient MDA-MB-436 cells following transfection with scrambled (black) or RAD52 (white) siRNA and treatment with or without 6-OH-dopa. Data shown as average ± s.e.m. from triplicates. *P = 0.0004; two-tailed Student’s t-test. j, Plots showing percent increase in γH2AX foci in BRCA1 proficient (black) and deficient (grey) MDA-MB-436 cells following treatment with 6-OH-dopa (left). Percent increase was determined from the number of nuclei with greater than five γH2AX foci. Data shown as average ± s.e.m. from 3 independent experiments. Cell images show DAPI staining (blue) and γH2AX foci (green)(right). **P = 0.002, ***P = 0.0078; two-tailed Student’s t-test. k, Plots showing percent of BRCA2 deficient (grey; VC8) and proficient (black; V79) cells positive for annexin V following treatment with 6-OH-dopa. *P = 0.01, **P = 0.003; two-tailed Student’s t-test (left). Plots showing percent of BRCA1 deficient (grey) and proficient (black) HCC1937 cells positive for annexin V following treatment with 6-OH-dopa (right).
Figure 7
Figure 7. Models of small molecule inhibition of RAD52
a, Models of 6-OH-dopa action. b, Model of small molecule disruption of RAD52 undecamers. c, Models of small molecule disruption of RAD52 WT heptamer superstructures (left) and stacked heptamer superstructures (right).

References

    1. Benson FE, Baumann P, West SC. Synergistic actions of Rad51 and Rad52 in recombination and DNA repair. Nature. 1998;391:401–404. - PubMed
    1. Ceccaldi RL, JC, Amunugama R, Hajdu I, Primack B, Petalcorin MIR, O’Connor KWK, PA, Elledge SJ, Boulton SJ, Yusufzai YT, D’Andrea AD. Homologous-recombination-deficient tumours are dependent on Polθ-mediated repair. Nature. 2015:517. - PMC - PubMed
    1. Chun J, Buechelmaier ES, Powell SN. Rad51 paralog complexes BCDX2 and CX3 act at different stages in the BRCA1-BRCA2-dependent homologous recombination pathway. Molecular and cellular biology. 2013;33:387–395. - PMC - PubMed
    1. Ciccia A, Elledge SJ. The DNA damage response: making it safe to play with knives. Molecular cell. 2010;40:179–204. - PMC - PubMed
    1. Cramer-Morales K, Nieborowska-Skorska M, Scheibner K, Padget M, Irvine DA, Sliwinski T, Haas K, Lee J, Geng H, Roy D, et al. Personalized synthetic lethality induced by targeting RAD52 in leukemias identified by gene mutation and expression profile. Blood 2013 - PMC - PubMed

Publication types

MeSH terms

LinkOut - more resources