. 2016 Jan 15;594(2):453-68.
doi: 10.1113/JP271365. Epub 2015 Dec 15.

Acute resistance exercise activates rapamycin-sensitive and -insensitive mechanisms that control translational activity and capacity in skeletal muscle

Affiliations

Acute resistance exercise activates rapamycin-sensitive and -insensitive mechanisms that control translational activity and capacity in skeletal muscle

Daniel W D West et al. J Physiol. .

Abstract

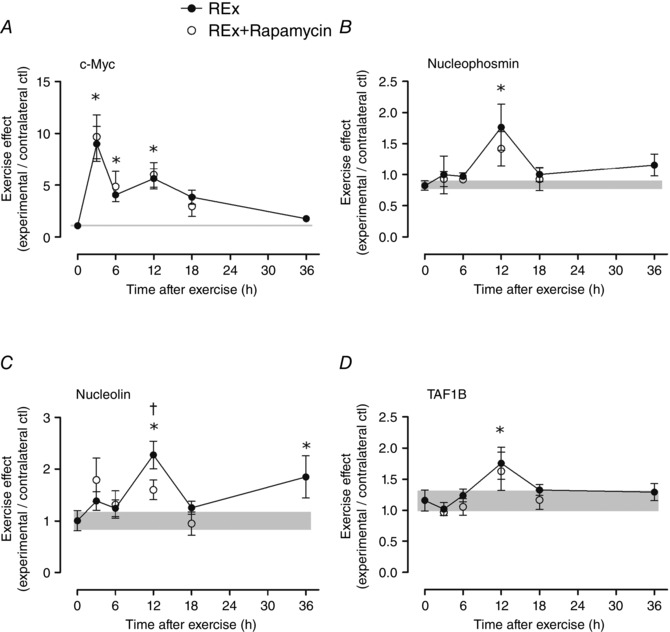
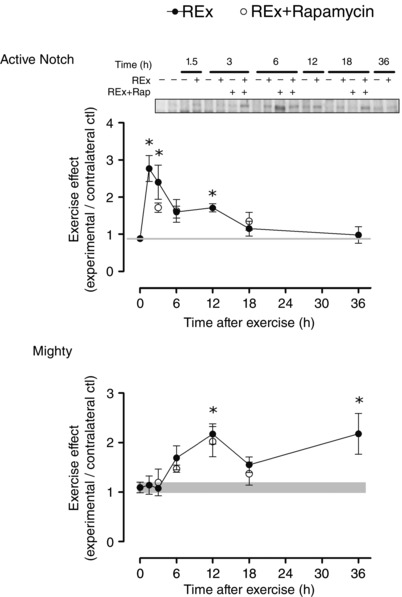
Key points: Ribosome biogenesis is the primary determinant of translational capacity, but its regulation in skeletal muscle following acute resistance exercise is poorly understood. Resistance exercise increases muscle protein synthesis acutely, and muscle mass with training, but the role of translational capacity in these processes is unclear. Here, we show that acute resistance exercise activated pathways controlling translational activity and capacity through both rapamycin-sensitive and -insensitive mechanisms. Transcription factor c-Myc and its downstream targets, which are known to regulate ribosome biogenesis in other cell types, were upregulated after resistance exercise in a rapamycin-independent manner and may play a role in determining translational capacity in skeletal muscle. Local inhibition of myostatin was also not affected by rapamycin and may contribute to the rapamycin-independent effects of resistance exercise.

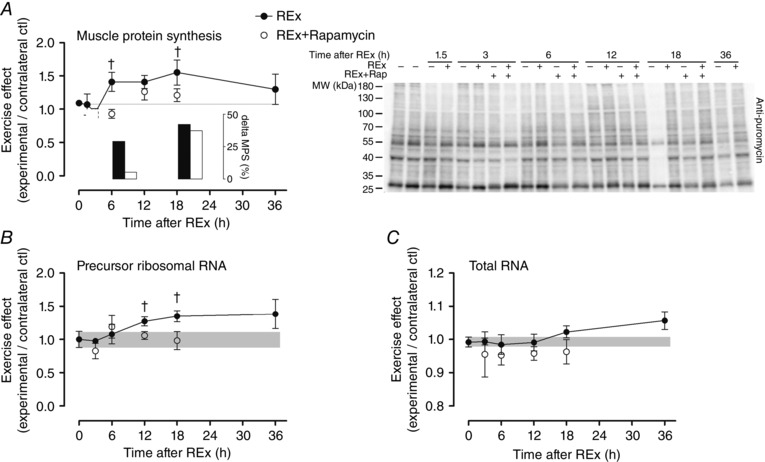
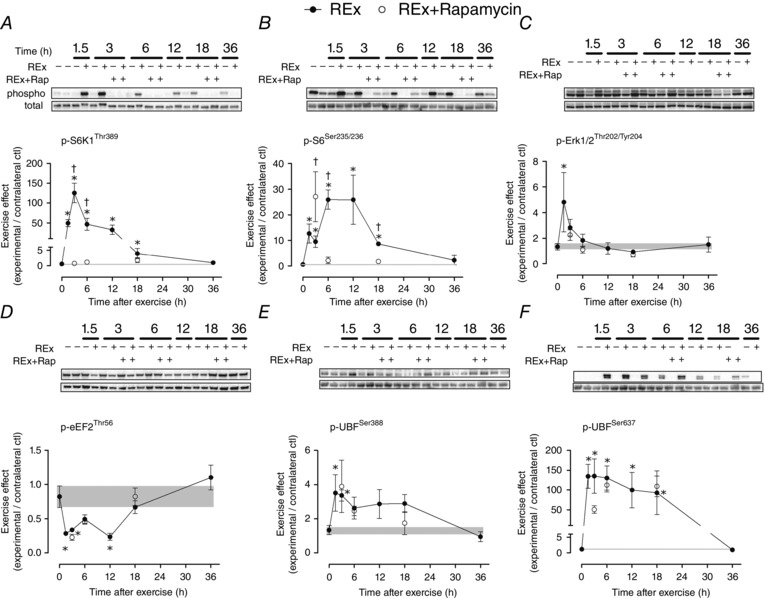
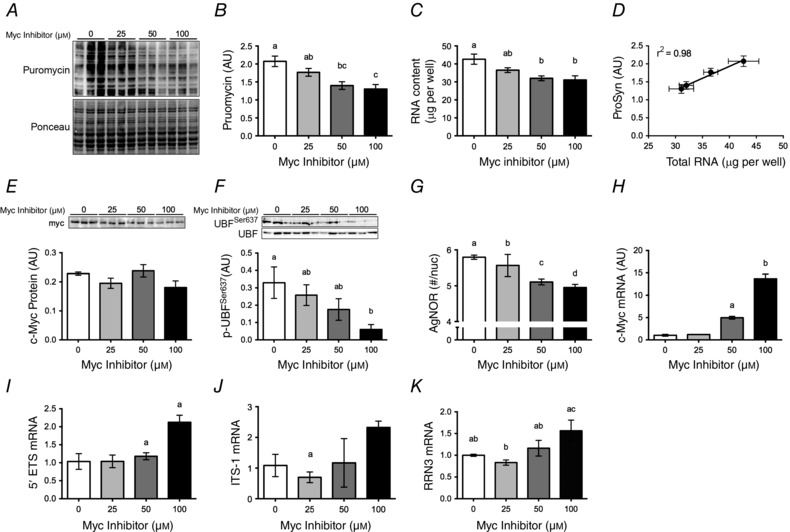
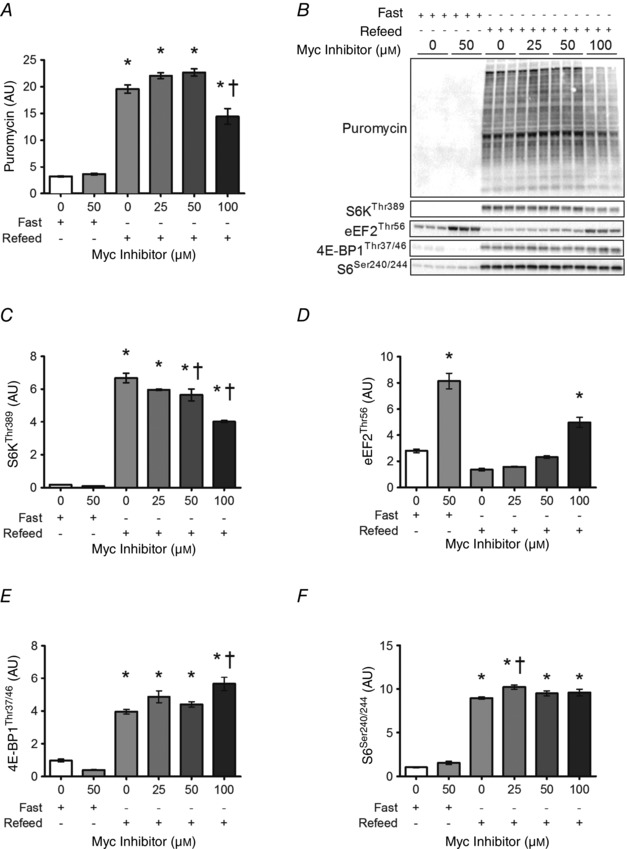
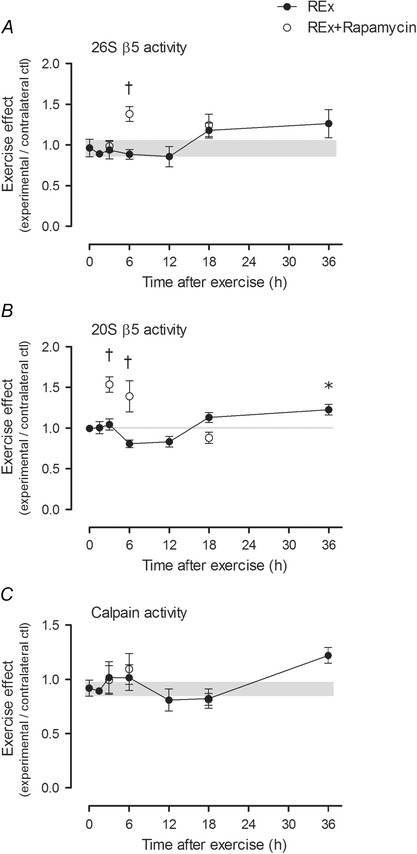
Abstract: This study aimed to determine (1) the effect of acute resistance exercise on mechanisms of ribosome biogenesis, and (2) the impact of mammalian target of rapamycin on ribosome biogenesis, and muscle protein synthesis (MPS) and degradation. Female F344BN rats underwent unilateral electrical stimulation of the sciatic nerve to mimic resistance exercise in the tibialis anterior (TA) muscle. TA muscles were collected at intervals over the 36 h of exercise recovery (REx); separate groups of animals were administered rapamycin pre-exercise (REx+Rapamycin). Resistance exercise led to a prolonged (6-36 h) elevation (30-50%) of MPS that was fully blocked by rapamycin at 6 h but only partially at 18 h. REx also altered pathways that regulate protein homeostasis and mRNA translation in a manner that was both rapamycin-sensitive (proteasome activity; phosphorylation of S6K1 and rpS6) and rapamycin-insensitive (phosphorylation of eEF2, ERK1/2 and UBF; gene expression of the myostatin target Mighty as well as c-Myc and its targets involved in ribosome biogenesis). The role of c-Myc was tested in vitro using the inhibitor 10058-F4, which, over time, decreased basal RNA and MPS in a dose-dependent manner (correlation of RNA and MPS, r(2) = 0.98), even though it had no effect on the acute stimulation of protein synthesis. In conclusion, acute resistance exercise stimulated rapamycin-sensitive and -insensitive mechanisms that regulate translation activity and capacity.


Figures

Figure 1
Figure 1. Acute resistance exercise on muscle protein synthesis
The effect of acute resistance exercise (REx, closed circles) on muscle protein synthesis (MPS; A; P = 0.042, for effect of time; representative blot at right), precursor ribosomal RNA (B; P = 0.054, for effect of time) and total RNA (C; P = 0.085, for effect of time). The ‘0’ time point is a non‐stimulated control group with its error term shaded to aid visual comparisons. Rapamycin was administered (pre‐exercise, 1.5 mg kg−1 by i.p. injection) to groups shown in open circles. MPS was assessed by measuring the incorporation of puromycin into nascent peptides by Western blot; inset shows change in MPS from the initial time point of each group to MPS at 6 and 18 h. Newly synthesized pre‐rRNA was measured using internal transcribed spacer 1 gene expression as a readout. Difference between REx and REx+Rapamycin at the same time point, P < 0.05. Values are expressed as experimental/contralateral control muscles, means ± SEM.
Figure 2
Figure 2. Resistance exercise and proteins that regulate translational activity
The effect of resistance exercise (REx, closed circles) on the phosphoryation of proteins that regulate translational activity (AD) and capacity (E and F). The ‘0’ time point is a non‐stimulated control group with its error term shaded to aid visual comparisons. Rapamycin was administered (pre‐exercise, 1.5 mg kg−1 by i.p. injection) to groups shown in open circles. Data are expressed as experimental/contralateral control muscles, with geometric means ± SEM. *Difference between REx and non‐stimulated control group, P < 0.05. Difference between REx and REx+Rapamycin at the same time point, P < 0.05.
Figure 3
Figure 3. Expression of genes associated with ribosome biogenesis after resistance exercise
c‐Myc (A), nucleophosmin (B), nucleolin (C) and TATA box binding protein‐associated factor RNA Pol I B (TAF1B; D). The ‘0’ time point is a non‐stimulated control group with its error term shaded to aid visual comparisons. Rapamycin was administered (pre‐exercise, 1.5 mg kg−1 by i.p. injection) to groups shown in open circles. Values (means ± SEM) are expressed relative to GAPDH and the contralateral control using the ΔΔC t method. *Difference between REx and non‐stimulated control group, P < 0.05. Difference between REx and REx+Rapamycin at the same time point, P < 0.05.
Figure 4
Figure 4. Notch protein expression and Mighty gene expression after resistance exercise
Active Notch (Notch intracellular domain) protein expression (A) and Mighty gene expression (B) after resistance exercise (REx). Notch activation inhibits myostatin signalling, as reflected by an increase in Mighty gene expression. Time points: 0 (non‐stimulated control group), 1.5, 3, 6, 12, 18, 36 h after REx. Rapamycin was administered (pre‐exercise, 1.5 mg kg−1 by i.p. injection) to groups shown in open circles. For active Notch, values are expressed as experimental/contralateral control muscles. For Mighty, values are expressed relative to GAPDH and the contralateral control using the ΔΔC t method. Values are means ± SEM. *Difference between REx and non‐stimulated control group, P < 0.05.
Figure 5
Figure 5. Inhibition of c‐Myc in vitro alters translational capacity
A, differentiated C2C12 myotubes were treated with an Myc inhibitor at the concentrations shown for 8 h (0 μm = solvent control). For MPS analysis, myotubes were incubated with 1 μm puromycin for 5 min before collection and detection of puromycin‐conjugated nascent peptides by Western blot. B–G, muscle protein synthesis (B, MPS) and total RNA in myotubes after c‐Myc inhibitor treatment (C) are directly related (D), c‐Myc (E) and phospho‐UBF Ser637 protein (F), and argyrophylic proteins in the nucleolar organizer region (G) following treatment with the small molecule c‐Myc inhibitor (0 μm = vehicle control). H–K, expression of c‐Myc (H), 5′ external transcribed spacer (5’ETS) (I), internal transcribed spacer 1 (ITS‐1) (J) and RNA polymerase I transcription factor (RRN3) (K) apparently demonstrates feedback upregulation at high inhibitor concentration. Data shown are representative of three independent experiments. Values are means ± SEM. Means with different letters are significantly different from each other, P < 0.01.
Figure 6
Figure 6. MPS and mTORC1 signalling in myotubes treated with c‐Myc inhibitor
Acute muscle protein synthesis (MPS; A) and mTORC1 signalling (C–F) in myotubes treated with c‐Myc inhibitor. Differentiated C2C12 myotubes were fasted for 30 min in PBS containing 2% horse serum prior to 60 min in GM supplemented with 100 nm IGF‐1 in the presence or absence of increasing doses of Myc inhibitor. For MPS analysis, myotubes were incubated with 1 μm puromycin for 5 min before collection and detection of puromycin‐conjugated nascent peptides by Western blot. Representative data shown are one of two independent experiments. Values are means ± SEM. Means are significantly different from *control, or from control refeed value, P < 0.01.
Figure 7
Figure 7. Ubiquitin proteasome pathway and calpain activities after resistance exercise
A and B, 26S β5 (A) and 20S β5 (B) reflect ATP‐dependent and ‐independent chymotrypsin‐like activities of the β5 proteasomal subunit (respectively), which is the most important subunit for proteasome function (Jager et al. 1999). C, calpain activity at each time point. The ‘0’ time point is a non‐stimulated control group with its error term shaded to aid visual comparisons. Rapamycin was administered (pre‐exercise, 1.5 mg kg−1 by i.p. injection) to groups shown in open circles. Values are expressed as experimental/contralateral control muscles, means ± SEM. *Difference between REx and non‐stimulated control group, P < 0.05. Difference between REx and REx+Rapamycin at the same time point, P < 0.001.

References

    1. Adams GR, Caiozzo VJ, Haddad F & Baldwin KM (2002). Cellular and molecular responses to increased skeletal muscle loading after irradiation. Am J Physiol Cell Physiol 283, C1182–1195. - PubMed
    1. Akiho M, Nakashima H, Sakata M, Yamasa Y, Yamaguchi A & Sakuma K (2010). Expression profile of Notch‐1 in mechanically overloaded plantaris muscle of mice. Life Sci 86, 59–65. - PubMed
    1. Al‐Khalili L, de Castro Barbosa T, Ostling J, Massart J, Cuesta PG, Osler ME, Katayama M, Nystrom AC, Oscarsson J & Zierath JR (2014). Proteasome inhibition in skeletal muscle cells unmasks metabolic derangements in type 2 diabetes. Am J Physiol Cell Physiol 307, C774–787. - PubMed
    1. Altman DG, Gore SM, Gardner MJ & Pocock SJ (1983). Statistical guidelines for contributors to medical journals. Br Med J 286, 1489–1493. - PMC - PubMed
    1. Arabi A, Wu S, Ridderstrale K, Bierhoff H, Shiue C, Fatyol K, Fahlen S, Hydbring P, Soderberg O, Grummt I, Larsson LG & Wright AP (2005). c‐Myc associates with ribosomal DNA and activates RNA polymerase I transcription. Nat Cell Biol 7, 303–310. - PubMed

Publication types

Substances