. 2015 Nov 9:6:8720.
doi: 10.1038/ncomms9720.

Local 3D matrix microenvironment regulates cell migration through spatiotemporal dynamics of contractility-dependent adhesions

Affiliations

Local 3D matrix microenvironment regulates cell migration through spatiotemporal dynamics of contractility-dependent adhesions

Andrew D Doyle et al. Nat Commun. .

Abstract

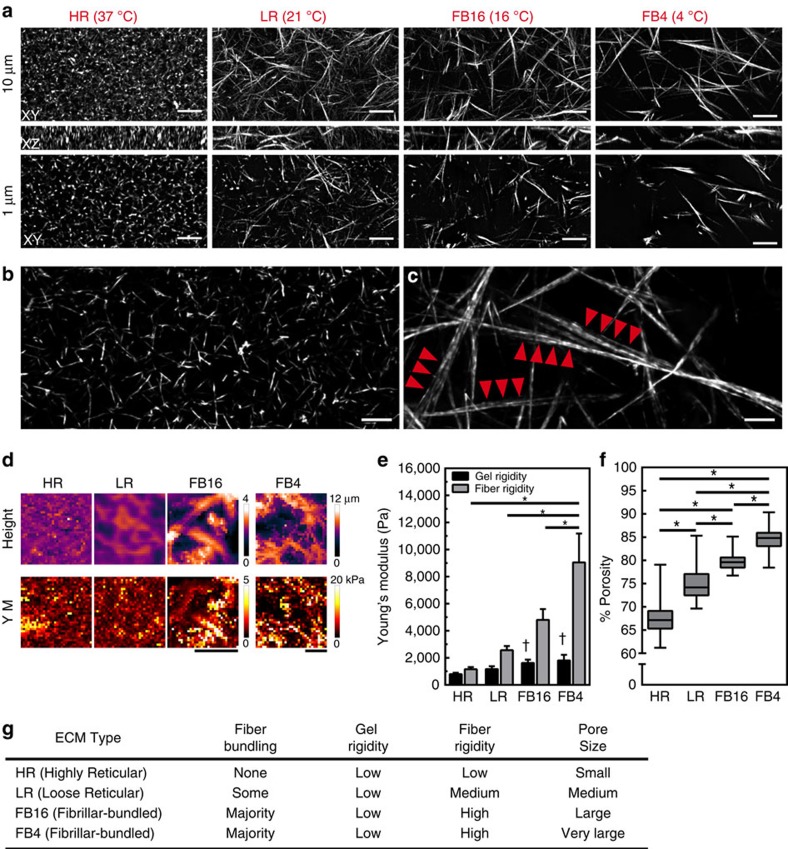
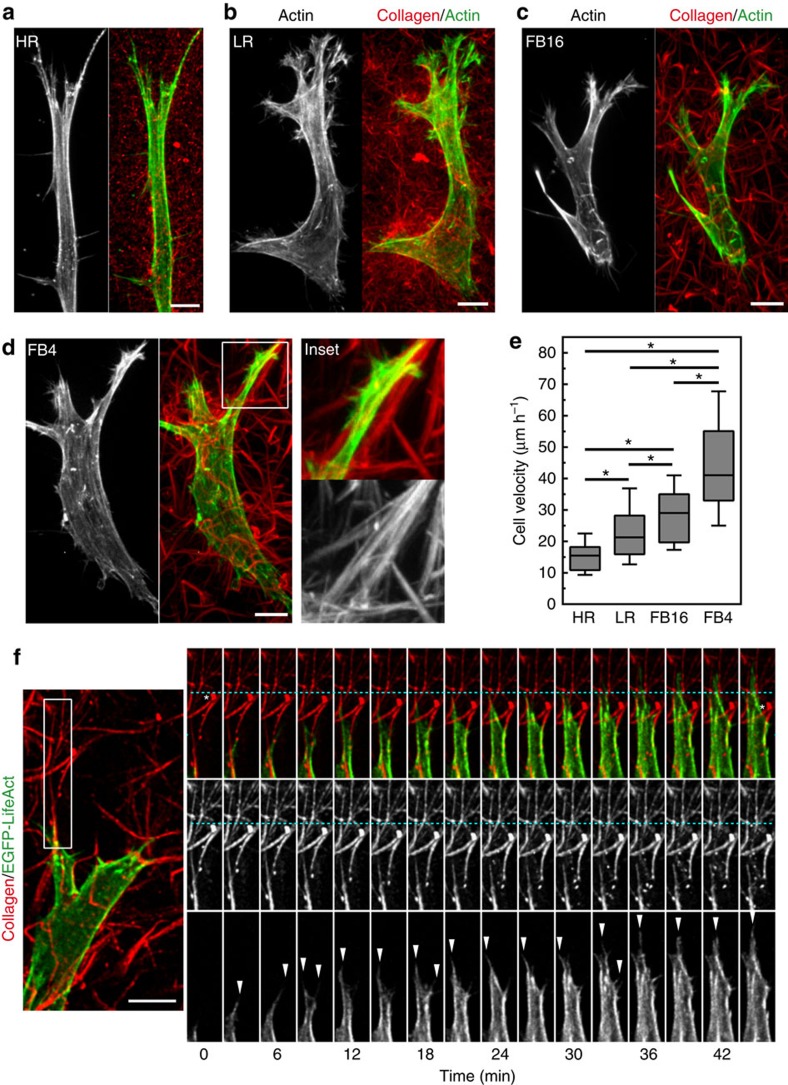
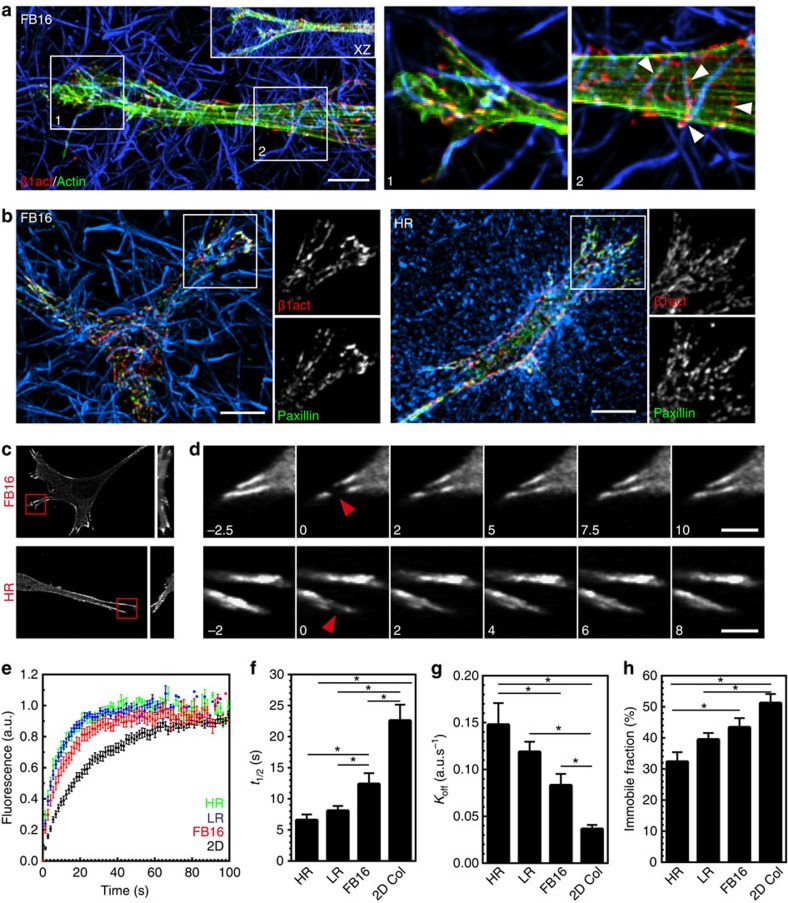
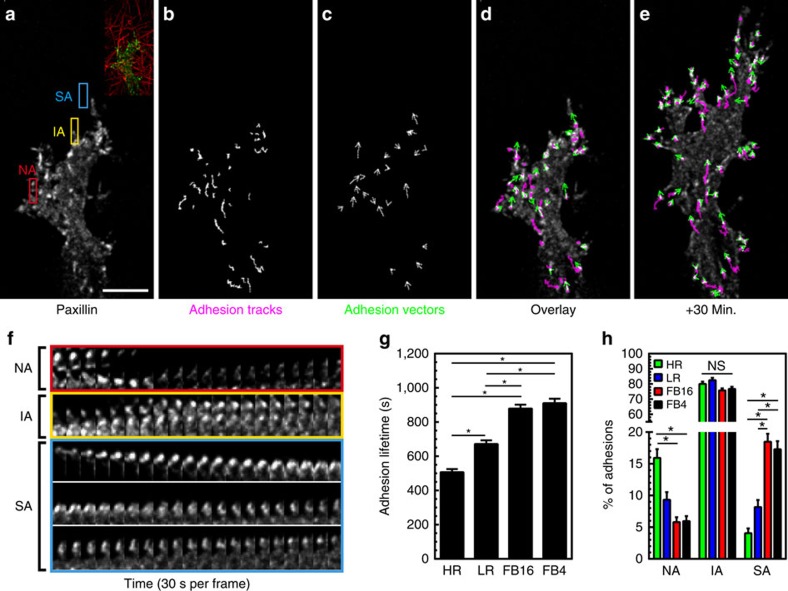
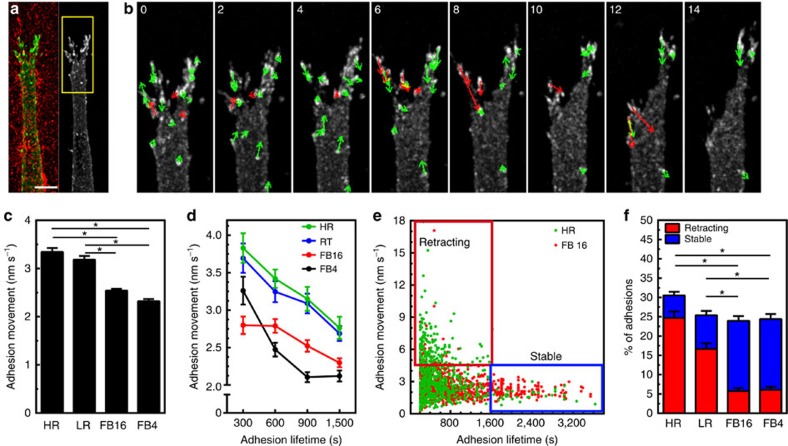
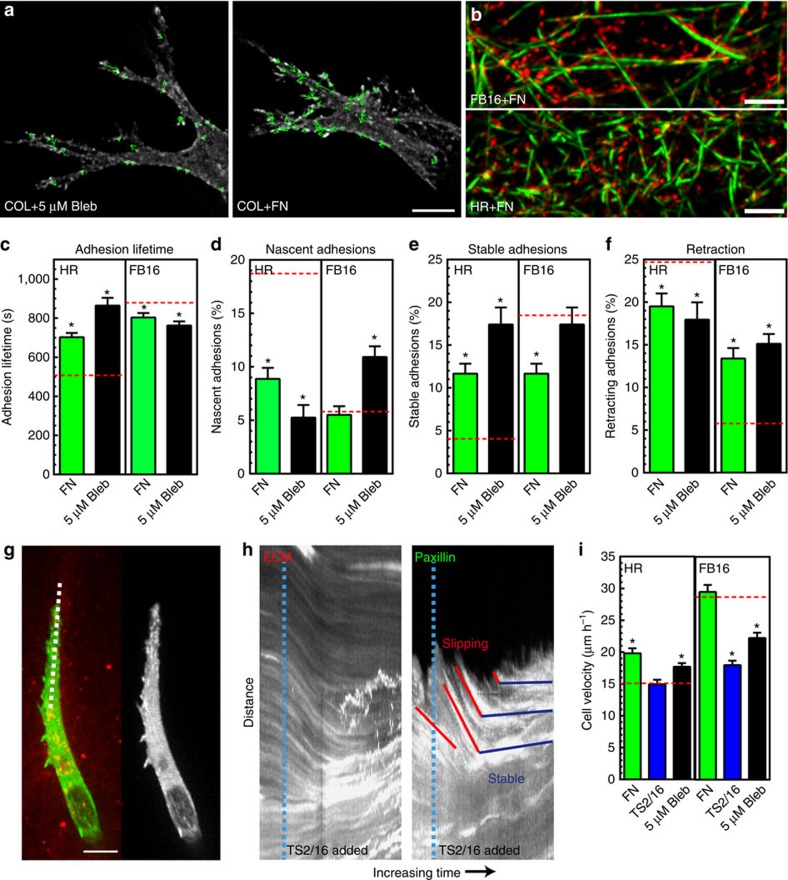
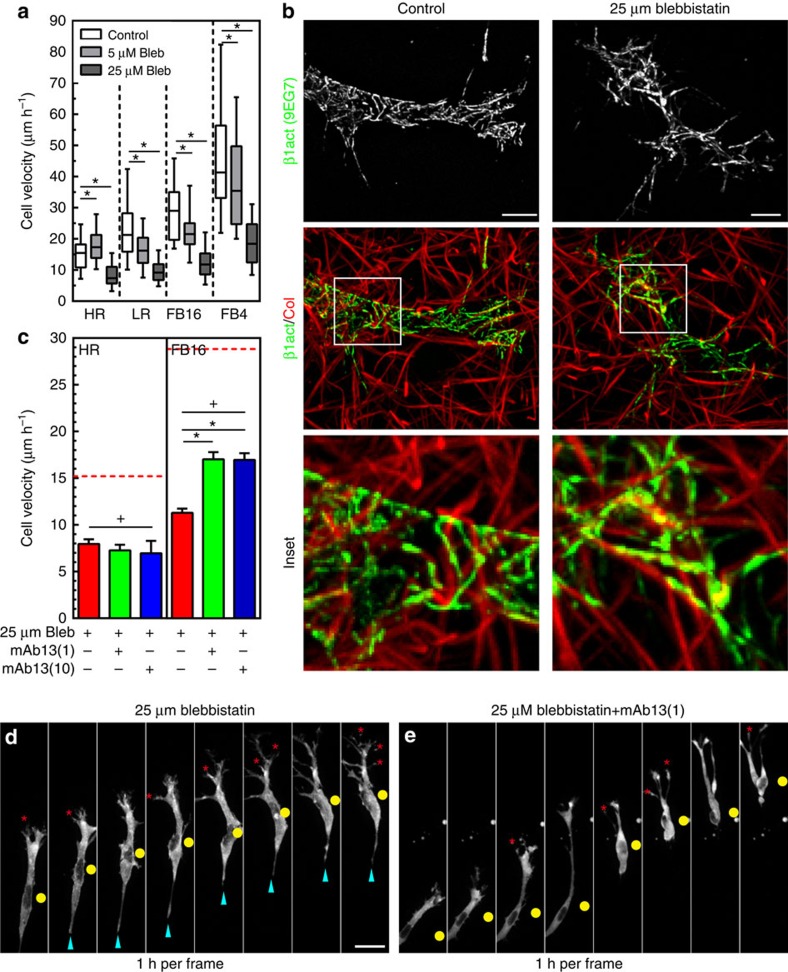
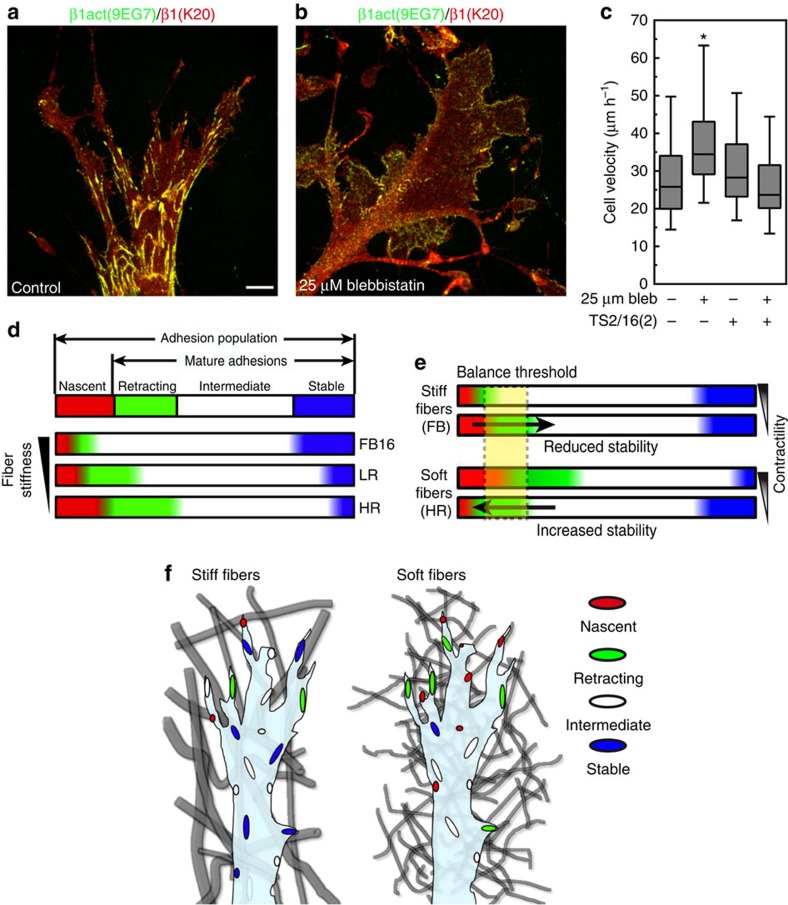
The physical properties of two-dimensional (2D) extracellular matrices (ECMs) modulate cell adhesion dynamics and motility, but little is known about the roles of local microenvironmental differences in three-dimensional (3D) ECMs. Here we generate 3D collagen gels of varying matrix microarchitectures to characterize their regulation of 3D adhesion dynamics and cell migration. ECMs containing bundled fibrils demonstrate enhanced local adhesion-scale stiffness and increased adhesion stability through balanced ECM/adhesion coupling, whereas highly pliable reticular matrices promote adhesion retraction. 3D adhesion dynamics are locally regulated by ECM rigidity together with integrin/ECM association and myosin II contractility. Unlike 2D migration, abrogating contractility stalls 3D migration regardless of ECM pore size. We find force is not required for clustering of activated integrins on 3D native collagen fibrils. We propose that efficient 3D migration requires local balancing of contractility with ECM stiffness to stabilize adhesions, which facilitates the detachment of activated integrins from ECM fibrils.


Figures

Figure 1
Figure 1. 3D collagen gel heterogeneity is associated with local ECM stiffening.
(a) Ten-micrometre maximum intensity projection (MIP) XY (top), 10 μm XZ (middle), and 1 μm MIP XY (bottom) images of 3 mg ml−1 rat-tail collagen polymerized at different temperatures (37, 21, 16 and 4 °C) illustrating diverse ECM architectures: highly reticular (HR), loose reticular (LR), and fibrillar bundlled (FB). (b,c) Structured illumination microscopy of HR (b) and FB16 (c) collagen (2 μm MIP). Arrowheads in c indicate aligned bundlled fibrils not found in HR or LR ECMs. (d) Representative examples of AFM-generated local height (top) and Young's modulus (YM) force-volume (bottom) maps for all ECM conditions. (e) Average Young's modulus for gels and fibrils in each ECM condition; N=3, n=9. (f) Percent porosity of a 4-μm thick section of collagen for all ECM conditions. N=3, n>25. (g) Reference table summarizing the major structural features of each ECM condition. *P<0.05, significantly different. † Significantly different fibre rigidity in the same ECM condition, P<0.05 (ANOVA). Errors bars: s.e.m. Scale bars: (a) 10 μm; (b,c) 2 μm; (d) 20 μm.
Figure 2
Figure 2. Migratory differences and similarities as fibroblast traverse different ECM architectures.
(ad) MIP images of HFFs for actin (green) within Atto-647N labelled collagen gels (red) demonstrates cell morphology differences associated with HR, LR, FB16 and FB4 ECMs. Inset (white box in d) illustrates pseudopodial extension along bundled collagen fibrils in FB4 ECM. Note the changes in cell morphology with changes in the ECMs. (e) Fibroblast migration velocity for each ECM. N>3 replicates, n>60. Errors bars: s.e.m. (f) Live-cell microscopy of a fibroblast expressing EGFP-Lifeact (green or grayscale) within FB4 ECM (red). Timelapse montage (right panels) illustrates the formation of actin-rich filopodial structures (arrowheads) forming along bundled collagen fibrils, directing migration. White asterisks indicate the initial and final positions of collagen fibrils relative to a fiduciary line (cyan) after cellular contraction pulls the matrix towards the cell body, while the leading edge protrudes forward. *P<0.05 (ANOVA), N≥3, n≥70 for all conditions. Scale bars, 10 μm.
Figure 3
Figure 3. ECM fibre stiffness alters adhesion turnover but not adhesion components.
(a) Full MIP localizing activated β1 integrin (9EG7: red) and phalloidin staining for F-actin (green) in FB16 ECMs. Inset shows XZ projection. Panels 1 and 2 illustrate integrins following the contours of the ECM and not stress fibre arrangement (indicated by arrowheads). Panels 1 and 2 are partial Z projections of the cell region. (b) Localization of activated β1 integrin (9EG7: red) and paxillin (green) in FB16 (left) and HR collagen matrices (right). Insets show variable colocalization that is prominent at the leading edge. All images are maximum intensity Z projections of ∼30 μm. (c) MIP images showing eGFP–zyxin localization in HR or FB16 ECM acquired before FRAP. 3D YZ MIP shown on the right. (d) Timelapse sequence shown in c illustrating EGFP-zyxin FRAP kinetics. Red arrowheads indicate the FRAP site. Time is in seconds. (eh) FRAP kinetic analysis showing t1/2 (f) Koff rates (g) and immobile fractions related to the graphs in E. N≥3, and n≥20 for all conditions. Errors bars: s.e.m. *P<0.05 (ANOVA). Scale bars: (a,b) 10 μm, (d) 5 μm.
Figure 4
Figure 4. 3D adhesion maturation depends on ECM stiffness.
(a) MIP of EYFP-paxillin adhesions associating with FB4 collagen gels. Inset shows ECM structure. (b,c) Adhesion-tracking mapping of adhesion displacements over their lifetime, while adhesion vector mapping (c) illustrates their averaged instantaneous movement. (d,e) Overlay of EYFP-paxillin (white) adhesion tracks (magenta) and adhesion vectors (green) at the time point shown in a (d) and 30 min later (e). (f) Timelapse kymographs from the colour-coded boxes in a illustrating adhesions with different lifetimes. Red box: nascent adhesions (NA: 0–120 s.). Yellow box: intermediate adhesions (IA: 500–1,500 s.). Cyan box: stable adhesions (SA: >1,500 s.). Adhesion for cyan appears several frames after the initial timepoint. (g) Average lifetime of adhesions for each condition. (h) Percent of adhesions considered NA, IA, or SA in each ECM condition. n-values for (g,h) are >500 adhesions and a minimum of 6 cells per condition. Errors bars: s.e.m. *P<0.05 (ANOVA). Scale bar, 10 μm.
Figure 5
Figure 5. Identification of two distinct 3D adhesion populations dependent on ECM/rigidity.
(a,b) Rapid movements of EYFP-paxillin adhesions in HR collagen. (b) Timelapse montage of region depicted in a. Arrows indicate direction of adhesion movement: Red arrows highlight adhesions undergoing rapid movement that retract away from the leading edge and slow migration. Time is in min. (c) Average movement of adhesions within the different ECMs. (d,e) Adhesion movement plotted against grouped adhesion lifetime (d) or as a scatterplot (e). Boxes in e show retracting (red) and stable (blue) adhesion populations. (f) Percent of adhesions that are retracting (red) or stable (blue) in each ECM. n-values for (c) through (f) are >500 adhesions and a minimum of six cells per condition. Errors bars: s.e.m. *P<0.05 (ANOVA). Scale bar, 10 μm.
Figure 6
Figure 6. Balancing cytoskeletal tension with ECM/adhesion coupling is required for efficient 3D migration.
(a) Adhesion movements in HR collagen+5 μM blebbistatin (Bleb; left) and HR collagen+FN (right). (b) SIM images of 300 μg ml−1 fibronectin (red) associated with FB16 or HR collagen fibrils (green). (cf) Treatment of collagen with HPFN or reducing contractility with 5 μM blebbistatin has differential ECM-dependent effects on adhesion lifetime (c) nascent (d) and stable adhesions (e) and the population of retracting adhesions (f). Dashed red lines in (cf) indicate untreated control levels (DMSO, IgG). N≥3, n≥400. (g,h) Integrin activation (TS2/16; 2 μg ml−1) stabilizes adhesions. Kymographs ((g) dashed white line) show adhesion slippage and retraction (red lines) until the addition of TS2/16 antibody (dashed cyan lines in h). Antibody treatment activates integrins for ECM gripping and results in adhesion stabilization (horizontal blue lines). (i) Migration of HPFN, TS2/16, or 5 μM blebbistatin treated cells compared with controls N=3, n>48 (dashed red lines).* Significantly different from control ECM; P<0.05 (ANOVA). Errors bars: s.e.m. Scale bars: (a) 2 μm; (b,g) 10 μm.
Figure 7
Figure 7. Myosin II contractility regulates 3D migration independent of pore size.
(a) Fibroblast 3D migration rates for control (white) 5 μM (light grey) and 25 μM (dark grey) blebbistatin for each ECM architecture. N=3, n=48. (b) MIPs comparing activated β1 integrin (9EG7) in fibroblasts between control and overnight exposure to 25 μM blebbistatin in FB4 collagen. Inset illustrates that activated β1 integrin remains associated with collagen fibrils surrounding the cell body region in the absence of myosin II contractility. (c) Reducing integrin binding with an inhibitory antibody against β1 integrin (mAb13; 1 and 10 μg ml−1) partially rescues contractility-deficient migration, but in a pore size-dependent manner. Red dashed lines indicate control levels. N=3, n≥70.(d) Timelapse series of a fibroblast expressing EYFP-paxillin in FB16 ECM treated with 25 μM blebbistatin (added 30 min before first frame). Numerous protrusions (red asterisks) form but do not aid cell body movement (yellow circle), while an elongated tail (cyan arrowheads) hinders migration. (e) HFF treated with blebbistatin and mAb13 (1 μg ml−1) show fewer protrusions while showing no elongated tails and slipping through the matrix. *P<0.05 (ANOVA). + Significantly different from control conditions; P<0.05 (ANOVA). Errors bars: s.e.m. Scale bars: (b) 10 μm; (d,e) 30 μm.
Figure 8
Figure 8. Contractility independent increase in 2D migration is due to a concomitant decrease in integrin activation.
(a,b) Comparison of control (a) and treatment with 25 μM blebbistatin (b) on 2D collagen (50 μg ml−1) shows a lack of activated β1 integrin clustering (green) compared with K20 anti-total β1 integrin antibody (red). (c) Addition of the activating β1 integrin antibody TS2/16 (2 μg ml−1) to fibroblasts migrating across 2D globular collagen inhibits the increase in migration associated with 25 μM blebbistatin, N=3, n>80 (ANOVA). Errors bars: s.e.m. (d) Schematic summary of regulation by the 3D microenvironment of the dynamics of cell adhesions. The adhesion population consists of nascent (red) and mature adhesions, the latter comprised of retracting (green) intermediate (white), or stable (blue). As ECM fibre stiffness increases (bottom to top) the relative number of nascent and retracting adhesions are reduced, while highly stable adhesions are promoted. HR, LR and FB16 adhesion populations illustrate the actual calculated percentages for each condition. (e) Reducing the relative contractility of cells shifts the balance of nascent and retracting adhesions differently in soft (HR) and stiff (FB) ECMs, promoting further adhesion stability in the former. The critical balance threshold is shown in yellow. Arrows indicate change in the adhesion population above or below the threshold. (f) Schematic representation of the adhesion populations for cells within heterogeneous matrix of stiff fibrils (left) and homogeneous matrix of soft fibrils (right). Adhesion colour depicts the adhesion type shown in d. *Significantly different from all other conditions; P<0.05 (ANOVA). Scale bar, 10 μm.

References

    1. Humphrey J. D., Dufresne E. R. & Schwartz M. A. Mechanotransduction and extracellular matrix homeostasis. Nat. Rev. Mol. Cell BIol. 15, 802–812 (2014). - PMC - PubMed
    1. Doyle A. D., Petrie R. J., Kutys M. L. & Yamada K. M. Dimensions in cell migration. Curr. Opin. Cell Biol. 25, 642–649 (2013). - PMC - PubMed
    1. Friedl P. & Wolf K. Plasticity of cell migration: a multiscale tuning model. J. Cell Biol. 188, 11–19 (2010). - PMC - PubMed
    1. Wolf K. et al. Physical limits of cell migration: control by ECM space and nuclear deformation and tuning by proteolysis and traction force. J. Cell Biol. 201, 1069–1084 (2013). - PMC - PubMed
    1. Ridley A. J. et al. Cell migration: integrating signals from front to back. Science 302, 1704–1709 (2003). - PubMed

Publication types