. 2015 Nov 9:5:16279.
doi: 10.1038/srep16279.

Multimodal super-resolution optical microscopy visualizes the close connection between membrane and the cytoskeleton in liver sinusoidal endothelial cell fenestrations

Affiliations

Multimodal super-resolution optical microscopy visualizes the close connection between membrane and the cytoskeleton in liver sinusoidal endothelial cell fenestrations

Viola Mönkemöller et al. Sci Rep. .

Abstract

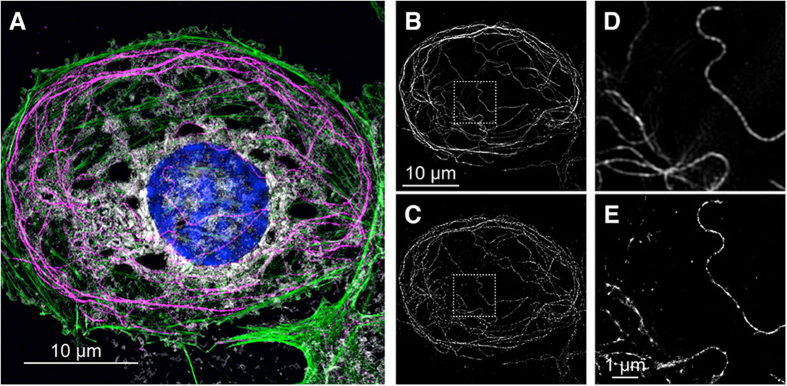
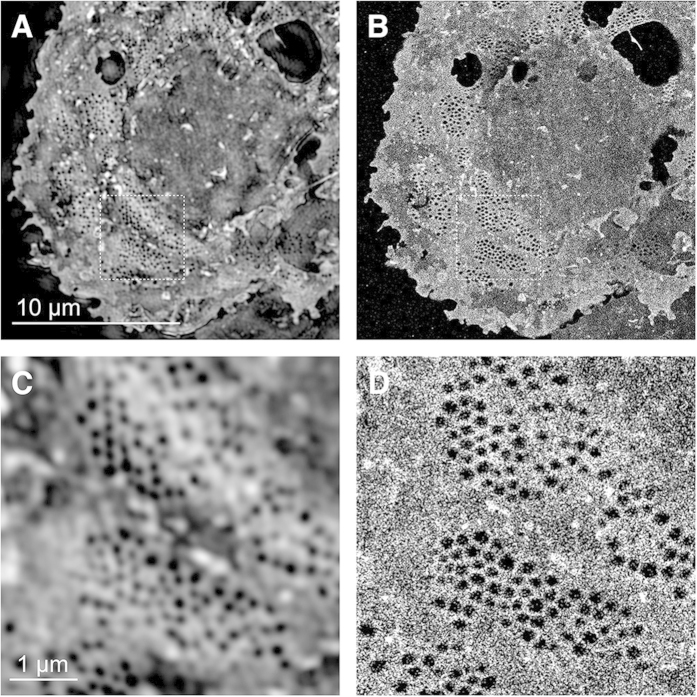
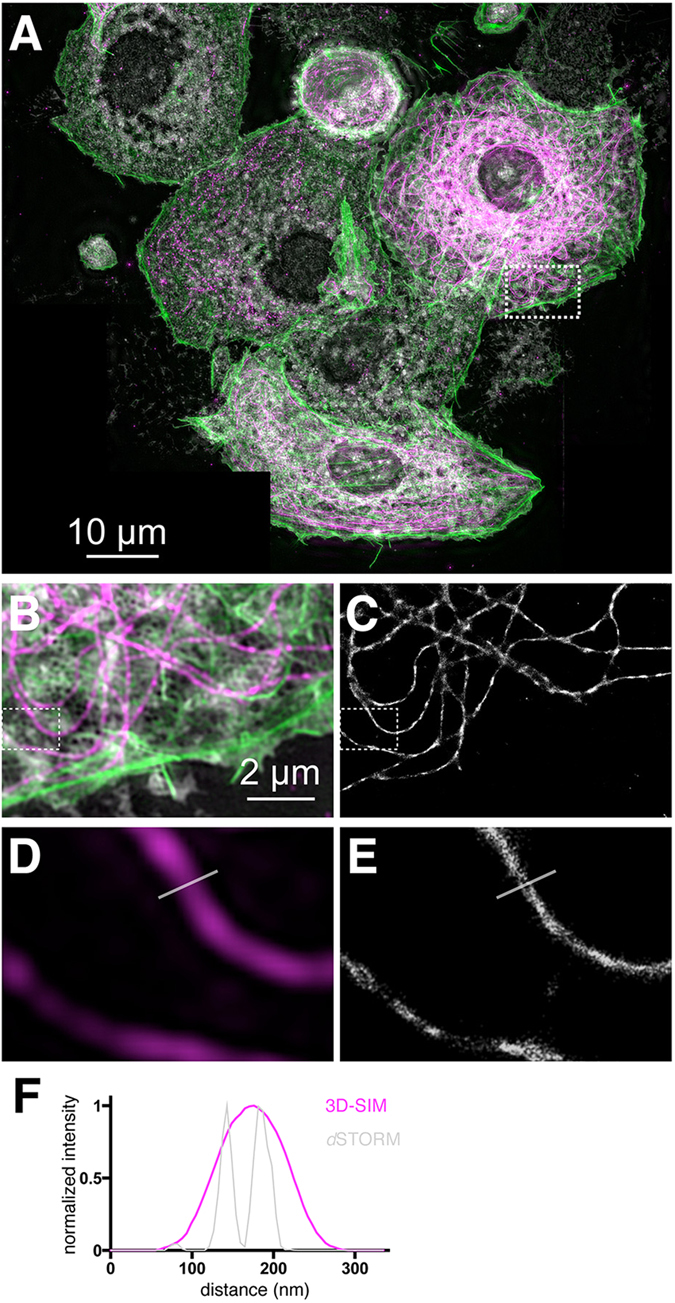
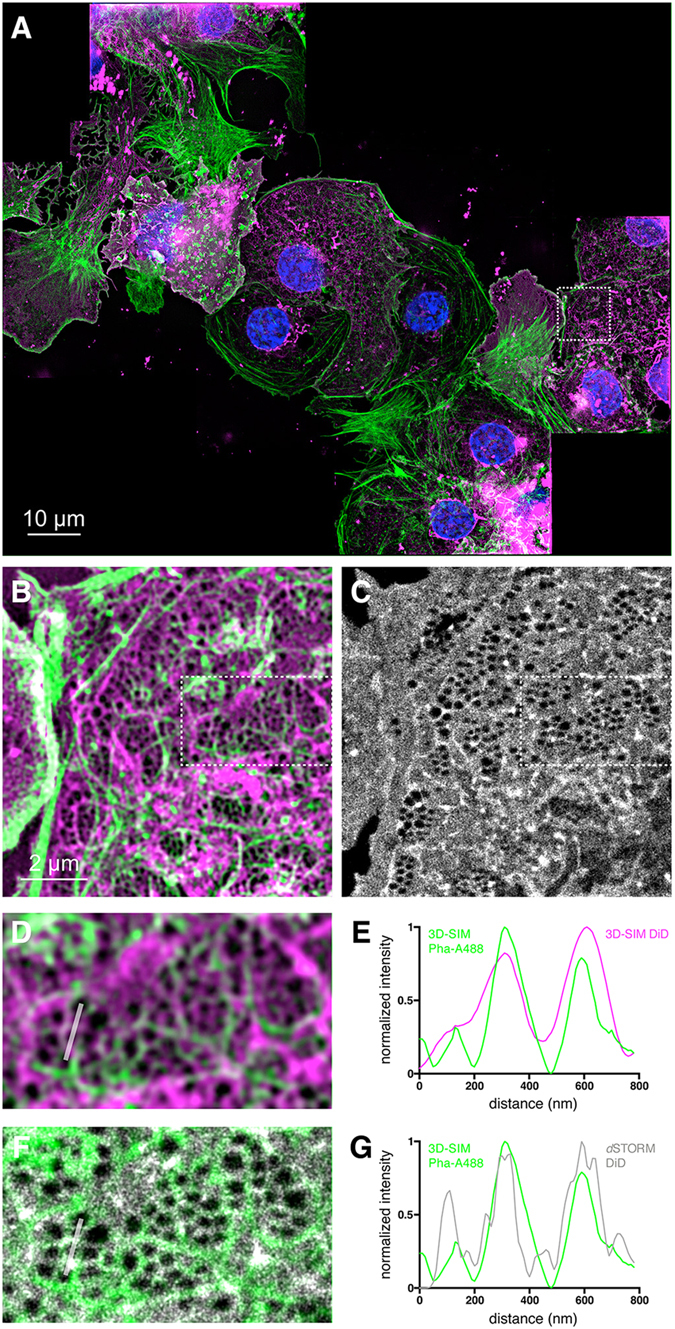
Liver sinusoidal endothelial cells (LSECs) act as a filter between blood and the hepatocytes. LSECs are highly fenestrated cells; they contain transcellular pores with diameters between 50 to 200 nm. The small sizes of the fenestrae have so far prohibited any functional analysis with standard and advanced light microscopy techniques. Only the advent of super-resolution optical fluorescence microscopy now permits the recording of such small cellular structures. Here, we demonstrate the complementary use of two different super-resolution optical microscopy modalities, 3D structured illumination microscopy (3D-SIM) and single molecule localization microscopy in a common optical platform to obtain new insights into the association between the cytoskeleton and the plasma membrane that supports the formation of fenestrations. We applied 3D-SIM to multi-color stained LSECs to acquire highly resolved overviews of large sample areas. We then further increased the spatial resolution for imaging fenestrations by single molecule localization microscopy applied to select small locations of interest in the same sample on the same microscope setup. We optimized the use of fluorescent membrane stains for these imaging conditions. The combination of these techniques offers a unique opportunity to significantly improve studies of subcellular ultrastructures such as LSEC fenestrations.


Figures

Figure 1
Figure 1. Correlating 3D-SIM and dSTORM images of a rat liver sinusoidal endothelial cell (LSEC).
(A) Maximum intensity z-projection 3D-SIM image of a 4-color-stained fixed rat LSEC. The nucleus was stained with DAPI (blue), actin filaments with Phalloidin-Alexa488 (green), membranes with CellMask Orange (white), and tubulin structures with anti β-tubulin mouse antibody followed by an anti-mouse IgG-Alexa647 antibody (magenta). The maximum intensity z-projection corresponds to a sample thickness of 750 nm. (B) Maximum intensity z-projection 3D-SIM image of the tubulin channel from (A) compared to the dSTORM reconstruction (C) of the same cell. (D) Enlarged 3D-SIM and (E) dSTORM images of the ROIs (dashed-line boxes) shown in (B,C). The dSTORM image shows a direct correlation with the corresponding 3D-SIM image, but with an optical resolution of approx. 20 nm. Note that the dSTORM image is obtained in HiLo mode, where in thicker parts of the cell not all of the entire volume of the cell is illuminated, resulting in small differences between the images. The single frame exposure time of the dSTORM image was 20 ms and a total of 10000 frames were used for the reconstruction. The sample was mounted in Vectashield.
Figure 2
Figure 2. Comparison of 3D-SIM and dSTORM images of fenestrations in rat LSECs stained with Vybrant DiD.
(A,C) 3D-SIM and corresponding (B,D) dSTORM images of a fixed rat LSECs stained with Vybrant DiD. The cells were mounted in the reducing buffer OSS + MEA (see Materials and Methods). (C,D) show enlarged views of the corresponding ROIs shown in (A,B). The 3D-SIM image is a maximum intensity z-projection image of a 500 nm thick part of the cell. The exposure time for a single dSTORM frame was 20 ms and 15000 frames were processed to reconstruct the images shown in (B,D).
Figure 3
Figure 3. Stitching of multicolor 3D-SIM super-resolution images aids in the search for sieve plates in LSECs.
(A) Seven multi-color maximum intensity z-projection 3D-SIM images of LSECs were stitched together to produce a large-scale overview image. The fixed rat LSECs were stained for membranes (CellMask Orange, white), actin (Phalloidin-Alexa488, green) and tubulin (mouse anti-β-tubulin and anti-mouse-Alexa647 antibodies, magenta). Scale bar: 10 μm.(B) Enlarged view of the ROI shown in (A). Tubulin is shown in magenta. (C) Corresponding dSTORM reconstruction of the tubulin network. (D) Zoomed view of the β-tubulin channel (magenta) outlined in the 3D-SIM image in (B). (E) Corresponding dSTORM image of β-tubulin. The line indicating the location of the cross-section has a length of 330 nm. (F) The line sections of the 3D-SIM and dSTORM tubulin channels show the resolution enhancement achieved by dSTORM (green line) compared to 3D-SIM (magenta line). The exposure time for a single dSTORM frame was 20 ms. 10000 frames were used for the reconstruction.
Figure 4
Figure 4. Comparison of cellular features imaged by different super-resolution microscopy modalities.
(A) Nine multi-color maximum intensity z-projection 3D-SIM images of fixed rat LSECs were stitched together to produce this overview image. The cells were stained for nuclei (DAPI, blue), actin (Phalloidin-Alexa488, green) and membrane (DiD, magenta). (B) Enlarged 3D-SIM view of the ROI shown in (A) highlighting how fenestrations are surrounded by actin fibers. (C) is the corresponding dSTORM image of the DiD membrane channel. (D) is an enlarged view of the ROI shown in (B). (E) Plot of the line section shown in (D) comparing the actin (green) and membrane (magenta) channels of the 3D-SIM image. (F) Overlay of the actin channel from 3D-SIM (D) shown in green and the membrane channel of dSTORM ((C), outlined box) shown in grey. (G) Plot of the line section shown in (F) comparing the 3D-SIM actin (green) and dSTORM membrane (grey) channels. (G) The actin line (green) shows the same trend as the membrane dSTORM line (grey), which suggests that actin filaments support fenestrations.

References

    1. Betzig E. Proposed Method for Molecular Optical Imaging. Opt. Lett. 20, 237–239 (1995). - PubMed
    1. Betzig E. et al. Imaging intracellular fluorescent proteins at nanometer resolution. Science 313, 1642–1645 (2006). - PubMed
    1. Gustafsson M. G. L., Agard D. A. & Sedat J. W. Doubling the lateral resolution of wide-field fluorescence microscopy using structured illumination. Proc. SPIE 3919, 141–150 (2000).
    1. Gustafsson M. G. L. et al. Three-dimensional resolution doubling in wide-field fluorescence microscopy by structured illumination. Biophys. J. 94, 4957–4970 (2008). - PMC - PubMed
    1. Hell S. W. Far-field optical nanoscopy. Science 316, 1153–1158 (2007). - PubMed

Publication types