. 2015 Nov 17;13(7):1336-1342.
doi: 10.1016/j.celrep.2015.10.015. Epub 2015 Nov 5.

Interneuronal Nitric Oxide Signaling Mediates Post-synaptic Long-Term Depression of Striatal Glutamatergic Synapses

Affiliations

Interneuronal Nitric Oxide Signaling Mediates Post-synaptic Long-Term Depression of Striatal Glutamatergic Synapses

Igor V Rafalovich et al. Cell Rep. .

Abstract

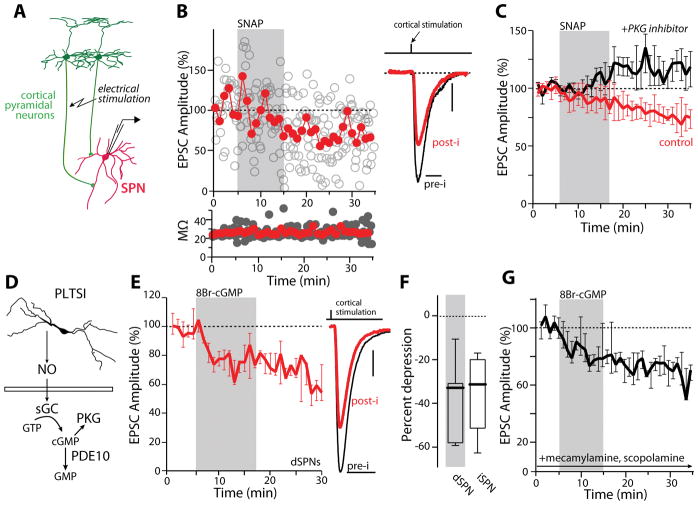
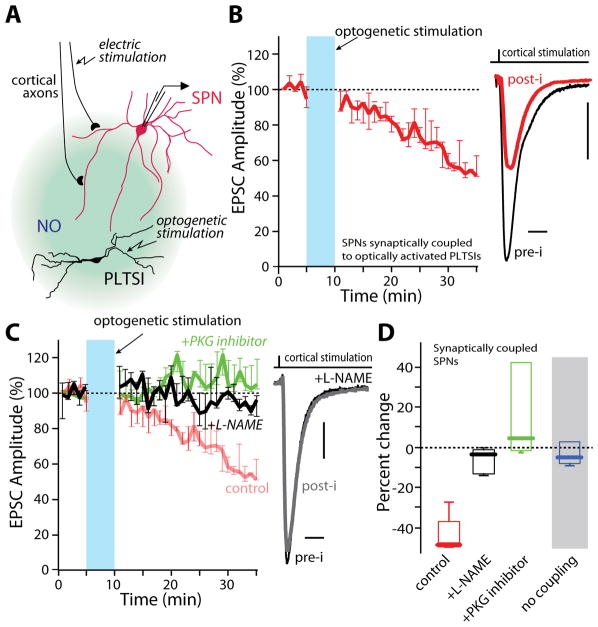
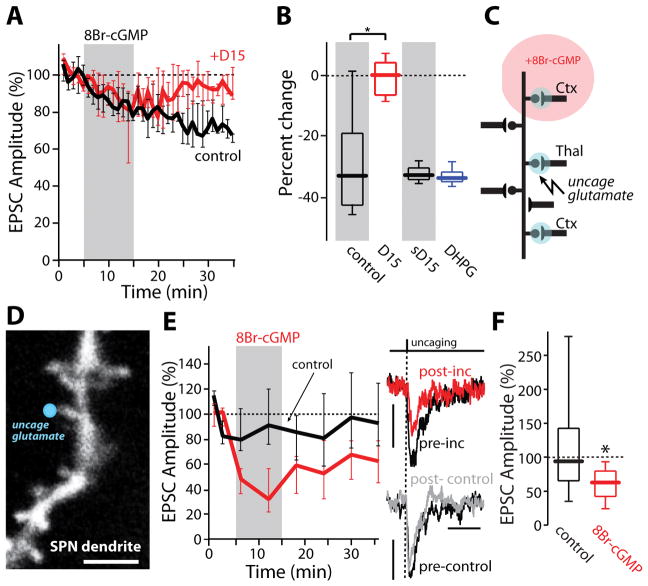
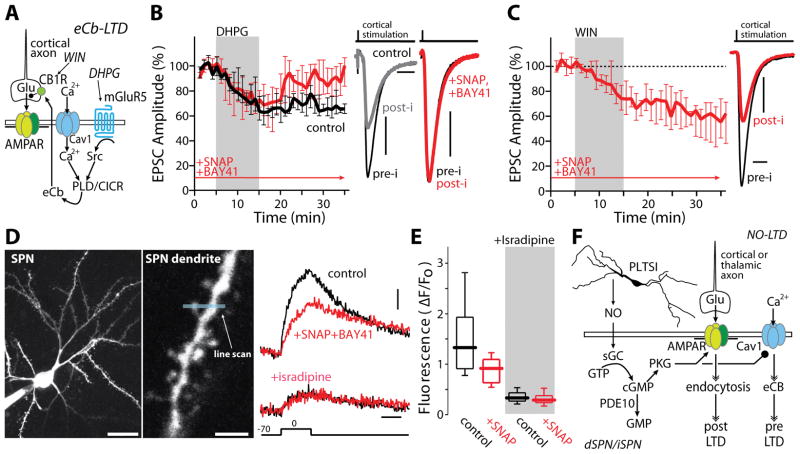
Experience-driven plasticity of glutamatergic synapses on striatal spiny projection neurons (SPNs) is thought to be essential to goal-directed behavior and habit formation. One major form of striatal plasticity, long-term depression (LTD), has long appeared to be expressed only pre-synaptically. Contrary to this view, nitric oxide (NO) generated by striatal interneurons was found to induce a post-synaptically expressed form of LTD at SPN glutamatergic synapses. This form of LTD was dependent on signaling through guanylyl cyclase and protein kinase G, both of which are abundantly expressed by SPNs. NO-LTD was unaffected by local synaptic activity or antagonism of endocannabinoid (eCb) and dopamine receptors, all of which modulate canonical, pre-synaptic LTD. Moreover, NO signaling disrupted induction of this canonical LTD by inhibiting dendritic Ca(2+) channels regulating eCb synthesis. These results establish an interneuron-dependent, heterosynaptic form of post-synaptic LTD that could act to promote stability of the striatal network during learning.


Figures

Figure 1
Figure 1
NO induces LTD at corticostriatal synapses through activation of PKG. (A) Simplified diagram depicting the circuit components being examined. (B) Sample whole cell recording of an SPN before, during and after a 10-minute application of the NO donor SNAP (100 μM). Open circles represent single EPSC events and solid line represents average EPSC size over a one-minute interval. EPSC amplitudes are normalized to baseline responses. Access resistance plotted below. Example EPSCs from this SPN are shown to the right before (pre-i, min 1–5 averaged) and after (post-i, min 30–35 averaged) SNAP application. The stimulus artifact has been suppressed for clarity. (C) PKG inhibition (3 μM, Rp-8-Br-PET-cGMPS, Rp8Br; black trace) blocked SNAP induced LTD (red trace) (control: n = 16 cells; PKG inhibitor: n=6). *p<0.05, signed rank test. (D) Cartoon diagram illustrating the NO signaling cascade. (E) Bath application of 8-Br-cGMP (500 μM) induced LTD in dSPNs (n=7). *p<0.05, signed rank test. Example EPSCs are shown to the right. (F) 8-Br-cGMP induced LTD similarly in iSPNs and dSPNs (dSPNs, from 1E: n=7; iSPN: n=9). *p<0.05, rank sum test. (G) SNAP induced LTD was unaffected by the inclusion of mecamylamine (10 μM) and scopolamine (10 μM) in the bath (n=5). Scale bars (vertical, horizontal): (B) 10 pA, 20 ms; (E) 25 pA, 20 ms.
Figure 2
Figure 2
NO producing interneurons can induce NO-LTD. (A) Simplified diagram depicting the experimental design used to optogenetically probe PLTSI involvement in NO-LTD. (B) Full field LED activation of PLTSIs for 5 minutes at 15 Hz induced NO-LTD at corticostriatal synapses in SPNs synaptically coupled to PLTSIs. Example traces shown to the right. (C) LTD was blocked by continuous bath application of the nNOS inhibitor L-NAME (100 μM) or inclusion of Rp8Br (3 μM) in the patch pipette (control: n=5; L-NAME: n=6; Rp8Br: n=5). Example EPSCs are shown at right. (D) Summary data for NO-LTD induced by PLTSI activation. SPNs not coupled to PLTSIs showed no response to the PLTSI stimulation paradigm (n=4). **p<0.01 Mann-Whitney nonparametric test. Scale bars: (B), (C) 20 pA, 10 ms.
Figure 3
Figure 3
NO-LTD is post-synaptically expressed. (A) 8-Br-cGMP (500 μM) induced NO-LTD which was blocked by intracellular application of the endocytosis-disrupting peptide, D15 (1–2 mM; control: black trace, n=6; D15: red trace, n=6). (B) Quantification of the population data shown in (A). A scrambled peptide (sD15) had no effect on 8-Br-cGMP NO-LTD (1–2 mM; n=6). As expected, sD15 did not disrupt LTD induced by DHPG (100 μM; n=6). * p<0.05, signed rank test. (C) Simplified diagram illustrating 2PLUG experiments. (D) Representative 2PLSM image of iSPN dendritic spine at which 2PLUG was performed (blue circle). (E) 8-Br-cGMP induced a long-lasting decrease in uEPSC amplitude. Example uEPSCs before (pre-inc) and after transient bath application of 8-Br-cGMP (500 μM) are shown to the right. Time matched control traces (no 8-Br-cGMP application; post-control) are shown for comparison. * p<0.05, signed rank test. (F) Summary data for 8Br-cGMP effect in SPN dendritic spines (8-Br-cGMP: n=26 spines, 5 cells; control: n=29 spines, 3 cells). Scale bars: (D) 3 μm; (E) 3 pA (right panel, top) and 5 pA, 50 ms (right panel, bottom).
Figure 4
Figure 4
NO signaling occludes eCb-LTD through L-type current inhibition. (A) Simplified diagram outlining the mechanisms behind eCB-LTD. (B) Induction of eCb-LTD by DHPG (100 μM; black trace, n=6) was prevented by SNAP (100 μM) and BAY-41 (10 μM) perfused 10 min before and throughout recording (red trace: n=8). *p<0.05, rank sum test. Example EPSCs are shown to the right. (C) LTD induced by pharmacological activation of pre-synaptic CB1 receptors with WIN (2 μM) was not blocked by SNAP/BAY-41 (n=7). *p<0.05, signed rank test. (D) 2PLSM images of an iSPN (left) and dendritic spine from which a Ca2+ imaging line scan (middle, blue line) was performed. Bath application of SNAP/BAY-41 reduced peak calcium influx (n=26 spines, 3 cells). This reduction was occluded in the presence of 5 μM isradipine (n=22 spines, 3 cells). (E) Quantification of (D). * p<0.05, signed rank test. (F) Integrated diagram depicting the interaction between eCB and NO LTD. Scale bars represent: (B) 20 pA, 25 ms; (C) 40 pA, 20 ms; (D) 20 μm (left panel), 3 μm (middle panel), 4%ΔF/Fo and 200 ms (right panel).

References

    1. Adermark L, Talani G, Lovinger DM. Endocannabinoid-dependent plasticity at GABAergic and glutamatergic synapses in the striatum is regulated by synaptic activity. European Journal of Neuroscience. 2009;29:32–41. - PMC - PubMed
    1. Albin RL, Young AB, Penney JB. The functional anatomy of basal ganglia disorders. Trends Neurosci. 1989;12:366–375. - PubMed
    1. Ariano MA. Distribution of components of the guanosine 3′,5′-phosphate system in rat caudate-putamen. Neuroscience. 1983;10:707–723. - PubMed
    1. Balleine BW, Delgado MR, Hikosaka O. The Role of the Dorsal Striatum in Reward and Decision-Making. Journal of Neuroscience. 2007;27:8161–8165. - PMC - PubMed
    1. Bender AT. Cyclic Nucleotide Phosphodiesterases: Molecular Regulation to Clinical Use. Pharmacological Reviews. 2006;58:488–520. - PubMed

Publication types

LinkOut - more resources