. 2015 Nov 9:6:8819.
doi: 10.1038/ncomms9819.

NADH oxidase-dependent CD39 expression by CD8(+) T cells modulates interferon gamma responses via generation of adenosine

Affiliations

NADH oxidase-dependent CD39 expression by CD8(+) T cells modulates interferon gamma responses via generation of adenosine

Aiping Bai et al. Nat Commun. .

Erratum in

Abstract

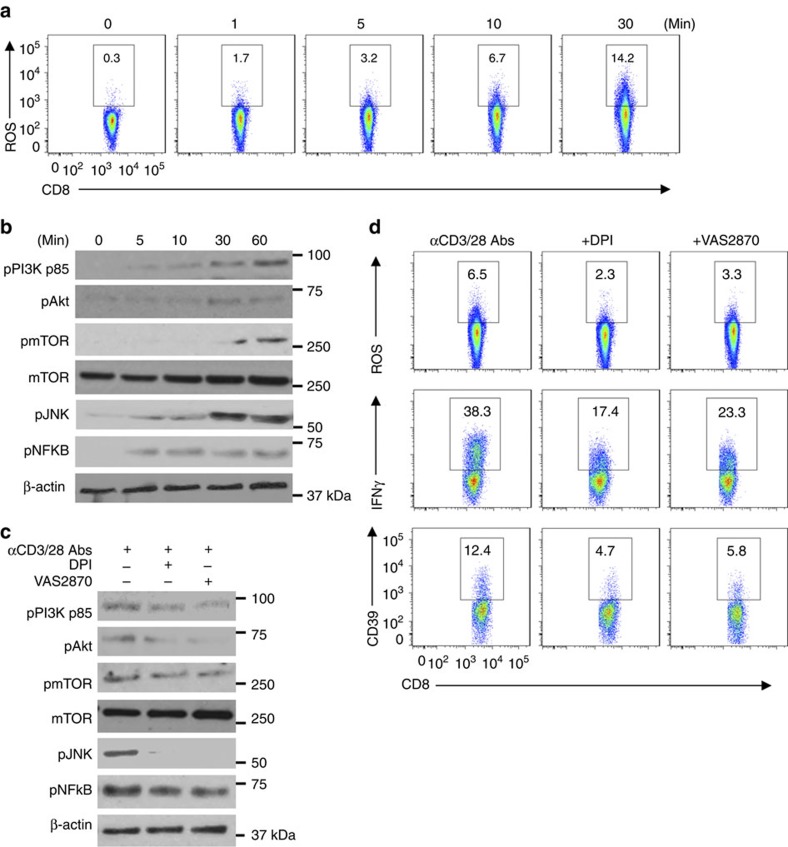
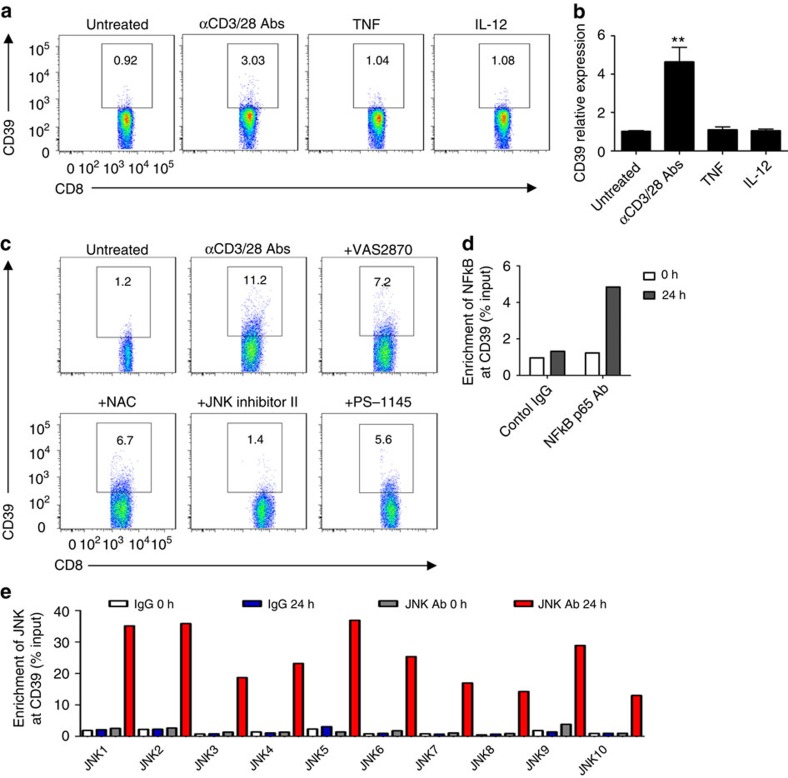
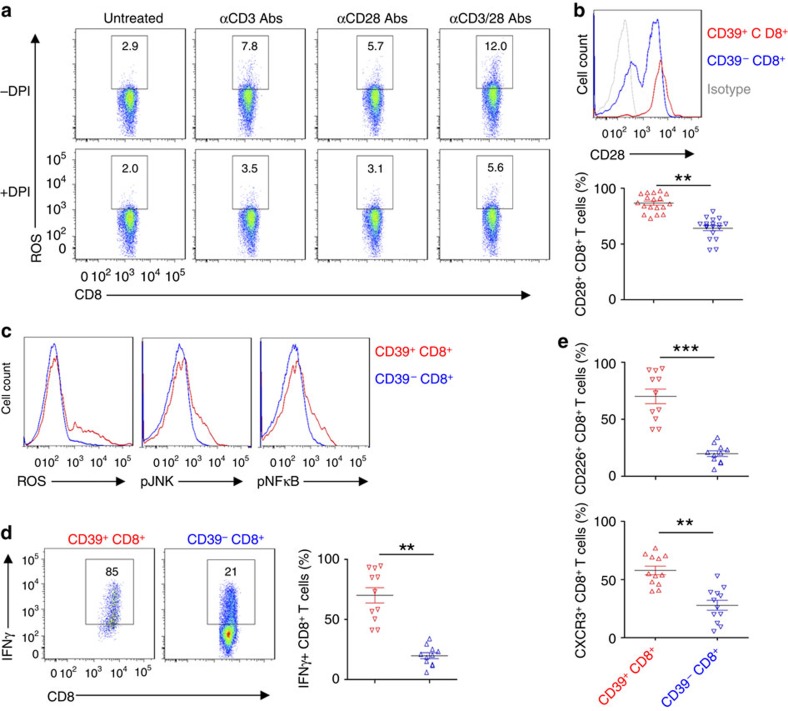
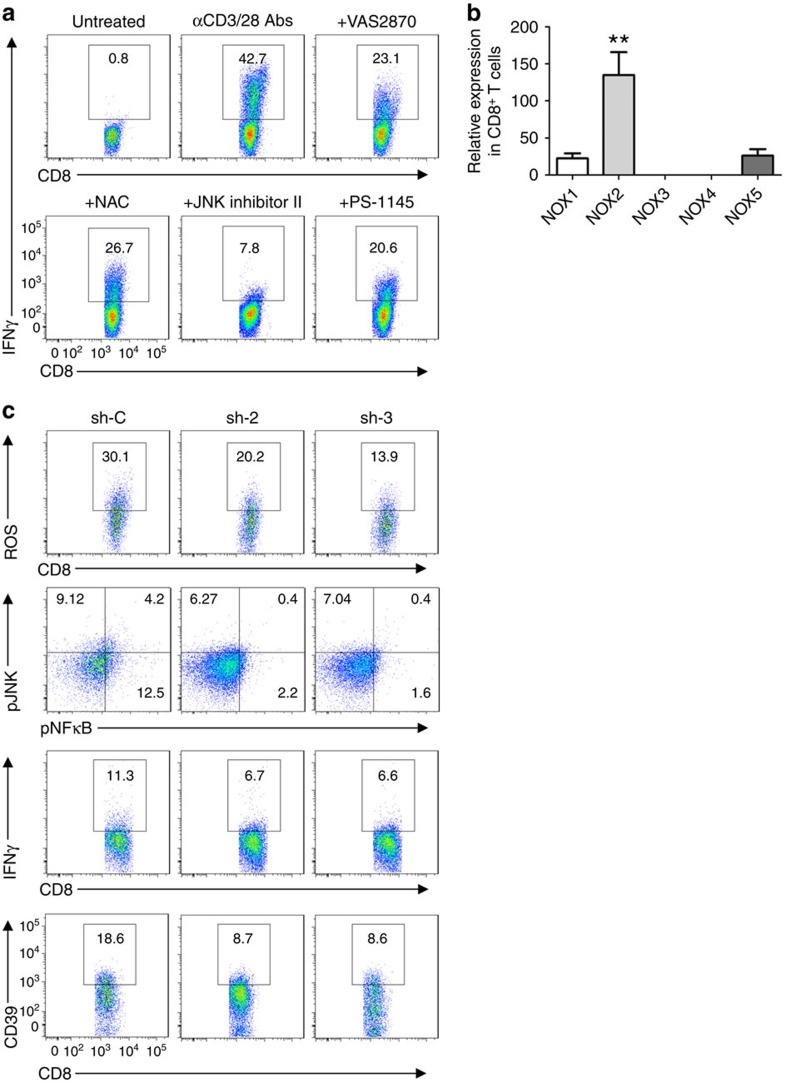
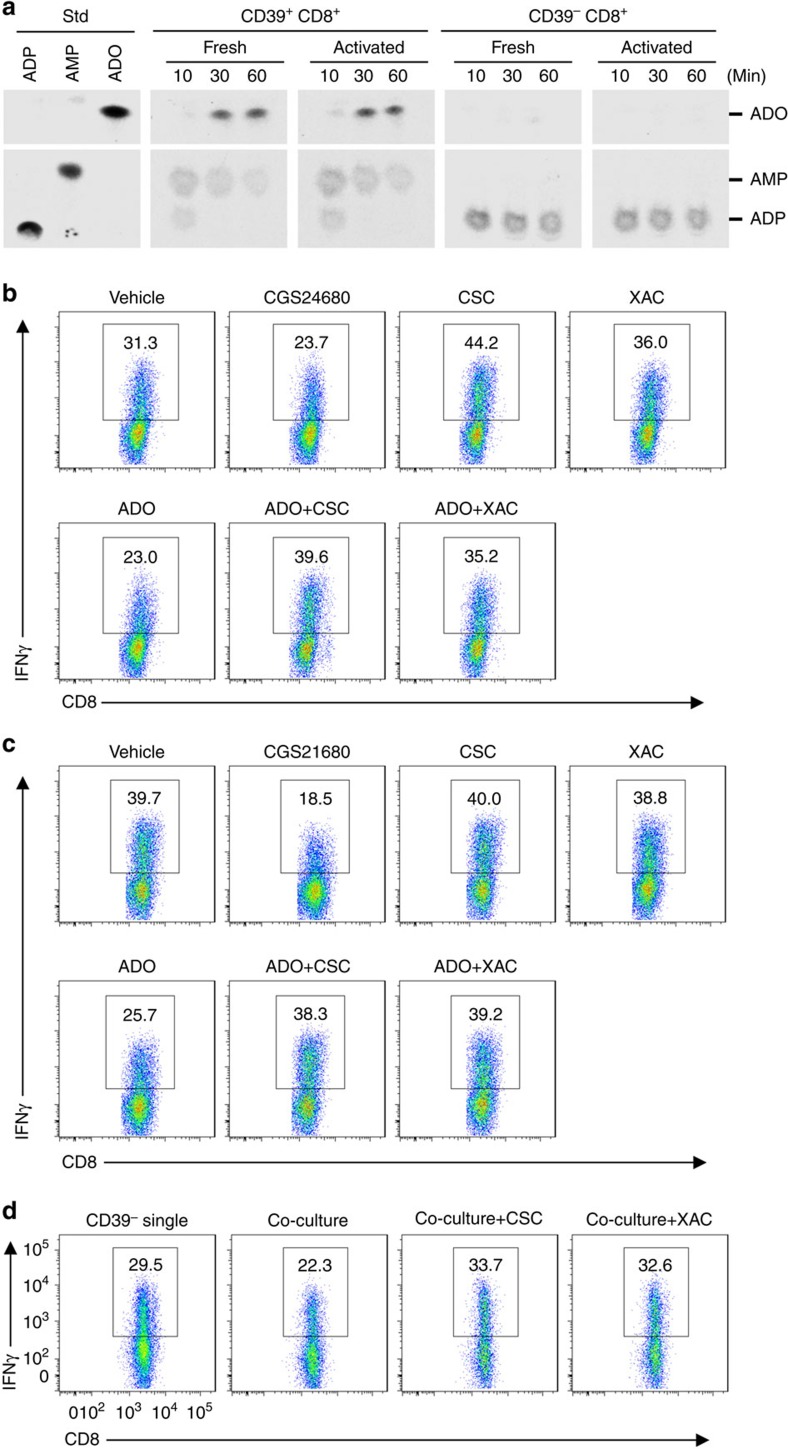
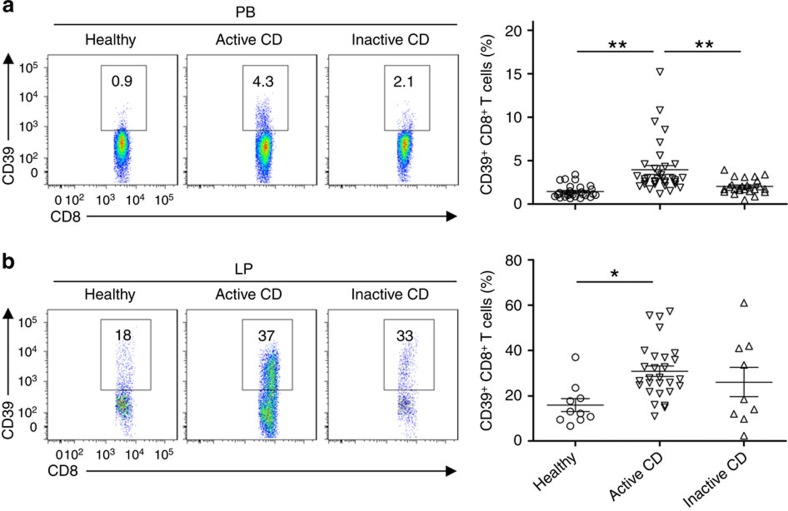
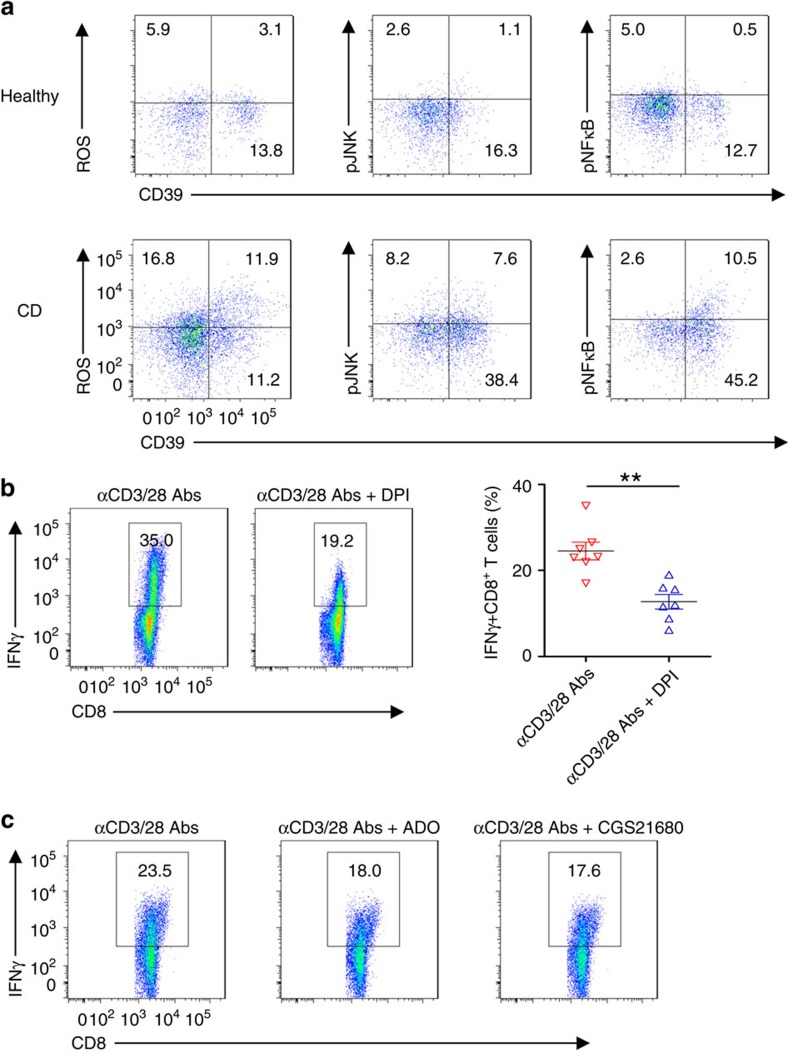
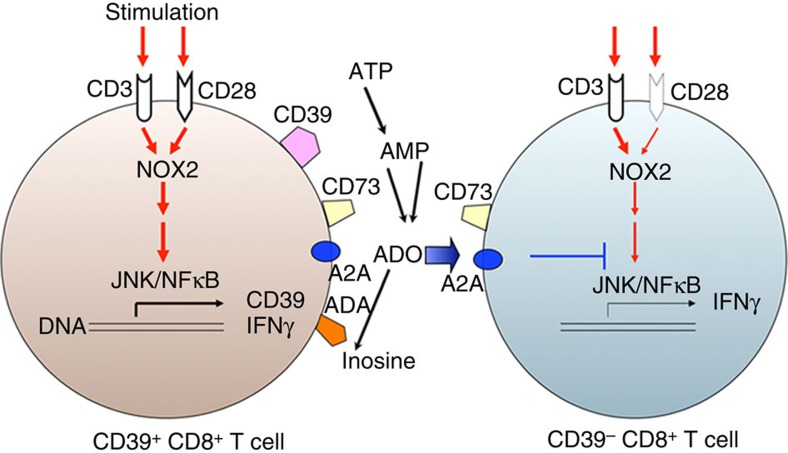
Interferon gamma (IFNγ)-producing CD8(+) T cells (Tc1) play important roles in immunological disease. We now report that CD3/CD28-mediated stimulation of CD8(+) T cells to generate Tc1 cells, not only increases IFNγ production but also boosts the generation of reactive oxygen species (ROS) and augments expression of CD39. Inhibition of NADPH oxidases or knockdown of gp91phox in CD8(+) T cells abrogates ROS generation, which in turn modulates JNK and NFκB signalling with decreases in both IFNγ levels and CD39 expression. CD39(+)CD8(+) T cells substantially inhibit IFNγ production by CD39(-)CD8(+) T cells via the paracrine generation of adenosine, which is operational via adenosine type 2A receptors. Increases in numbers of CD39(+)CD8(+) T cells and associated enhancements in ROS signal transduction are noted in cells from patients with Crohn's disease. Our findings provide insights into Tc1-mediated IFNγ responses and ROS generation and link these pathways to CD39/adenosine-mediated effects in immunological disease.


Figures

Figure 1
Figure 1. CD3/CD28-ROS signals modulate Tc1 development.
(a,b) Representative fluorescence-activated cell sorting (FACS) analyses of ROS induction (a) and western blotting indicating phosphorylation of intracellular CD3/CD28 downstream signalling components (b) in healthy blood CD8+ T cells stimulated with anti-CD3/CD28 antibodies at different time points. Cells were pretreated with 4 μM of H2DCFDA to allow for ROS determination. (c,d) Healthy peripheral blood CD8+ T cells were stimulated with anti-CD3/CD28 antibodies in the presence or absence of DPI (10 μM) or VAS2870 (10 μM), both NOX inhibitors, followed by determination of CD3/CD28 signalling transduction at 60 min by western blot (c), ROS at 10 min and IFNγ or CD39 expression at 24 or 72 h by FACS, respectively (d). All data are representative of 3–4 independent experiments.
Figure 2
Figure 2. CD39 expression in CD8+ T cells is JNK and NFκB dependent.
(a,b) Healthy blood CD8+ T cells were treated with anti-CD3 (10 μg ml−1, precoated) and anti-CD28 (5 μg ml−1, soluble) antibodies, or 10 ng ml−1 of the cytokines: either TNF or IL-12. CD39 expression was then determined by flow cytometry at 24 h (a) (n=4) or by quantitative PCR at 2 h (b) (n=4). (c) Healthy blood CD8+ T cells were stimulated with anti-CD3/CD28 antibodies in the presence or absence of VAS2870 (10 μM), NAC (10 mM), JNK inhibitor II (10 μM), PS-1145 (10 μM) for 72 h. CD39 expression was then analysed by fluorescence-activated cell sorting (n=3). (d,e) Chromatin immunoprecipitation analyses indicating enrichment of NFκB p65 (d) or JNK/c-Jun (e) at the CD39 promoter region in CD8+ T cells fresh isolated (fresh) or activated with anti-CD3/28 antibodies for 24 h (activated). Data are shown as mean±s.e.m., **P<0.001 (one-way analysis of variance), for the comparison with the other groups.
Figure 3
Figure 3. CD39+CD8+ T cells exhibit Tc1 responsiveness.
(a) Healthy blood CD8+ T cells were stimulated with anti-CD3 (10 μg ml−1) or/and CD28 (5 μg ml−1) antibodies in the presence of vehicle or DPI (10 μM), and ROS induction was determined at 30 min. (b) Flow cytometric analyses of CD28 expression was done as based on expression of CD39 on CD8+ T cells (n=18); statistical analysis of percentages of two CD8+ T-cell subsets is shown in lower panel. (c) Flow cytometry of ROS induction, phospho-JNK and phospho-NFκB p65 in CD8+ T cells, stimulated with anti-CD3/CD28 antibodies for 30 min. Cells were pretreated with 4 μM of H2DCFDA for ROS determination, as before. (d) Representative flow cytometric analyses of CD8+ T cells based on expression of CD39. CD8+ T cells were stimulated with anti-CD3/CD28 antibodies for 24 h. Statistical comparative analysis indicating different percentages of CD8+ T cells expressing IFNγ is shown in the right panel. (e) Flow analysis of CD226 (n=11) and CXCR3 (n=12) expression on CD39+CD8+ and CD39CD8+ T cells. Data are presented as means±s.e.m., **P<0.01, ***P<0.001 (Student's t-test).
Figure 4
Figure 4. CD3/CD28-ROS signals are NOX2 dependent.
(a) Representative flow cytometry of healthy blood CD8+ T cells, as determined on the basis of IFNγ expression (n=4). Freshly isolated CD8+ T cells were stimulated with anti-CD3 (10 μg ml−1, precoated) and anti-CD28 (5 μg ml−1, soluble) antibodies in the presence or absence of VAS2870 (10 μM), NAC (10 mM), JNK inhibitor II (10 μM) and PS-1145 (10 μM) for 24 h (n=3), as before. (b) Relative expression of NOX1–5 in healthy blood CD8+ T cells was determined by quantitative PCR, and GAPDH was used as internal control (n=3). (c) Control knockdown (sh-C) and NOX2 knockdown (sh-2 and sh-3) of healthy peripheral blood CD8+ T cells stimulated with anti-CD3/CD28 antibodies, followed by representative fluorescence-activated cell sorting analyses of: ROS at 60 min; CD3/CD28 signalling transduction pathways at 120 min and IFNγ or CD39 expression at 24 or 48 h, respectively. Cells were pretreated with 4 μM of H2DCFDA to allow for ROS examination. Data are presented as mean±s.e.m., **P<0.01 (one-way analysis of variance), with comparisons between groups.
Figure 5
Figure 5. Purinergic signalling modulates Tc1 responses.
(a) CD39+CD8+ or CD39CD8+ T cells were used after purification (fresh) or after activation using anti-CD3/CD28 antibodies for 3 h (activated). Phosphohydrolysis of extracellular 14C-radiolabelled ADP catalysed by fresh or activated CD39+CD8+ or CD39CD8+ T-cell subsets was determined by TLC. (b,c) Total CD8+ T cells (b) or freshly sorted CD39CD8+ T cells (c) were stimulated with anti-CD3/CD28 antibodies in the presence of vehicle or CGS21680 (100 nM), adenosine (ADO, 50 μM) alone or together with CSC (500 nM) or XAC (1 μM) for 24 h, IFNγ expression was analysed by fluorescence-activated cell sorting (FACS). (d) Carboxyfluorescein succinimidyl ester-labelled CD39CD8+ T cells alone or co-cultured with CD4+CD39+CD161+ T cells were stimulated with anti-CD3/CD28 antibodies for 24 h followed by FACS analysis of IFNγ expression. Co-cultures were incubated in the presence of vehicle, CSC (500 nM) or XAC (1 μM). Data are representative of three independent experiments.
Figure 6
Figure 6. CD39+CD8+ T cell numbers are increased in Crohn's disease (CD).
(a,b) Flow cytometric analyses of CD39 expression on CD8+ T cells in peripheral blood (PB) (a) or lamina propria (LP) (b) of healthy volunteers, patients with active and inactive CD (n=29, 35 or 25 for peripheral blood; 10, 28 or 9 for lamina propria, respectively). Numbers in quadrants indicate percentage of the cells in the designated gates. Data are presented as means±s.e.m., *P<0.01, **P<0.001 (one-way analysis of variance).
Figure 7
Figure 7. CD8+ T cells in Crohn's disease (CD) exhibit ROS signalling.
(a) Representative fluorescence-activated cell sorting (FACS) analyses of ROS induction and intracellular pJNK and pNFkB levels in lamina propria (LP) CD8+ T cells of healthy donors and active CD patients. LP CD8+ T cells were stimulated with anti-CD3/CD28 antibodies for 30 min. Cells were pretreated with 4 μM of H2DCFDA for ROS examination. Data are representative of 4–5 independent experiments. (b) Peripheral blood CD3+CD8+ T cells isolated from patients with active CD were stimulated with anti-CD3/CD28 antibodies in the presence of vehicle or DPI (10 μM) for 24 h, followed by determination of intracellular IFNγ levels by FACS. Statistical analyses of percentages of Tc1 are shown on the right in each panel (n=7). Data are shown as means±s.e.m., **P<0.005 (Student's t-test). (c) Peripheral blood CD8+ T cells of active CD patients were stimulated with anti-CD3/CD28 antibodies in the presence of vehicle, adenosine (ADO, 50 μM) or CGS21680 (100 nM), followed by analyses of IFNγ expression at 24 h by FACS. Data are representative of three independent experiments.
Figure 8
Figure 8. Schematic illustration of role of CD39 in Tc1 biology.
Anti-CD3 or/and CD28 stimulation induces ROS generation, which is associated with the activation of CD3 or/and CD28 intracellular signaling cascades, induction of IFNγ production and heightened CD39 expression in CD8+ T cells. Because of preferential CD28 expression, CD39+CD8+ T cells exhibit prominent ROS signalling and show excessive IFNγ production. CD39+CD8+ T cells also initiate purinergic signalling and generate adenosine, which can further inhibit JNK and NFκB signalling and decrease IFNγ production by these CD39CD8+ T cells via A2A receptor responses.

References

    1. Saurer L. & Mueller C. T cell-mediated immunoregulation in the gastrointestinal tract. Allergy 64, 505–519 (2009). - PubMed
    1. Suzuki M., Konya C., Goronzy J. J. & Weyand C. M. Inhibitory CD8+ T cells in autoimmune disease. Hum. Immunol. 69, 781–789 (2008). - PMC - PubMed
    1. Brown S. J. & Mayer L. The immune response in inflammatory bowel disease. Am. J. Gastroenterol. 102, 2058–2069 (2007). - PubMed
    1. Geremia A., Biancheri P., Allan P., Corazza G. R. & Di Sabatino A. Innate and adaptive immunity in inflammatory bowel disease. Autoimmun. Rev. 13, 3–10 (2014). - PubMed
    1. Coskun M., Salem M., Pedersen J. & Nielsen O. H. Involvement of JAK/STAT signaling in the pathogenesis of inflammatory bowel disease. Pharmacol. Res. 76, 1–8 (2013). - PubMed

Publication types

MeSH terms