. 2015 Nov 9:6:8823.
doi: 10.1038/ncomms9823.

Ikaros mediates gene silencing in T cells through Polycomb repressive complex 2

Affiliations

Ikaros mediates gene silencing in T cells through Polycomb repressive complex 2

Attila Oravecz et al. Nat Commun. .

Abstract

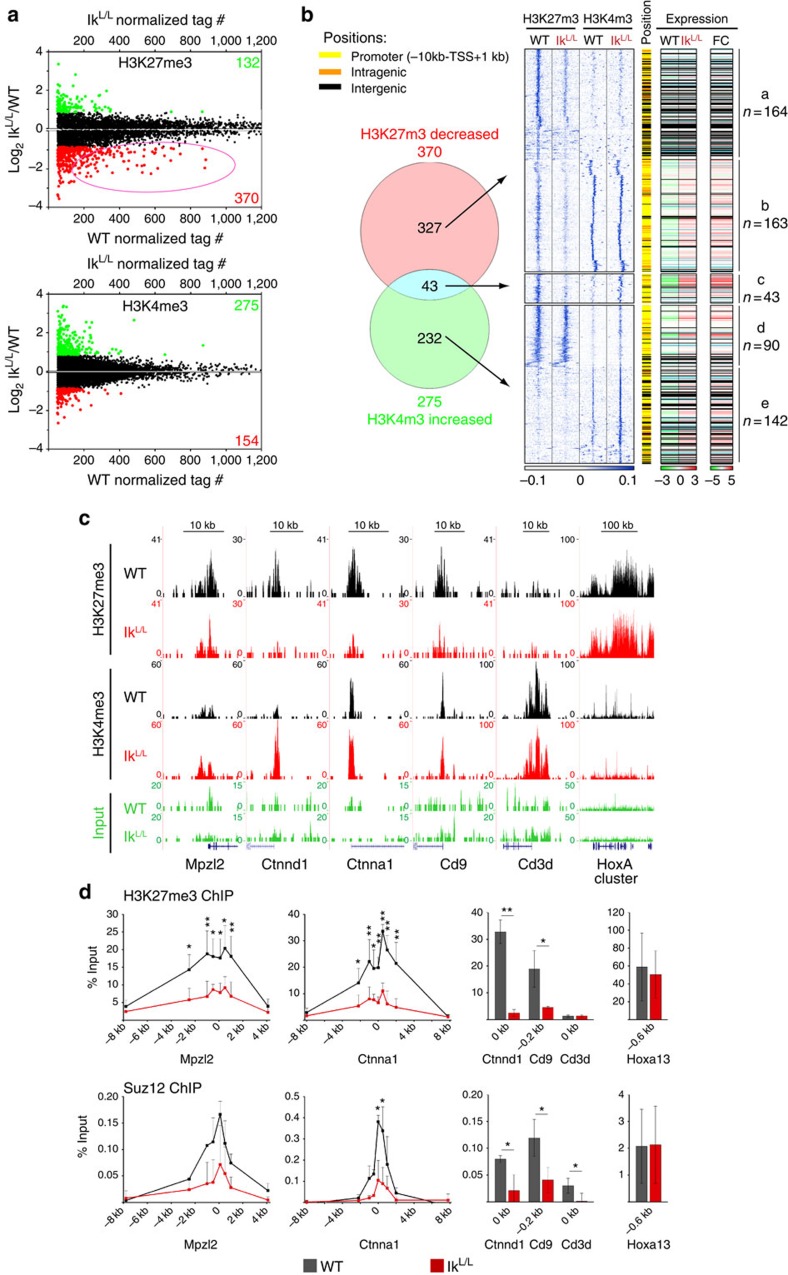
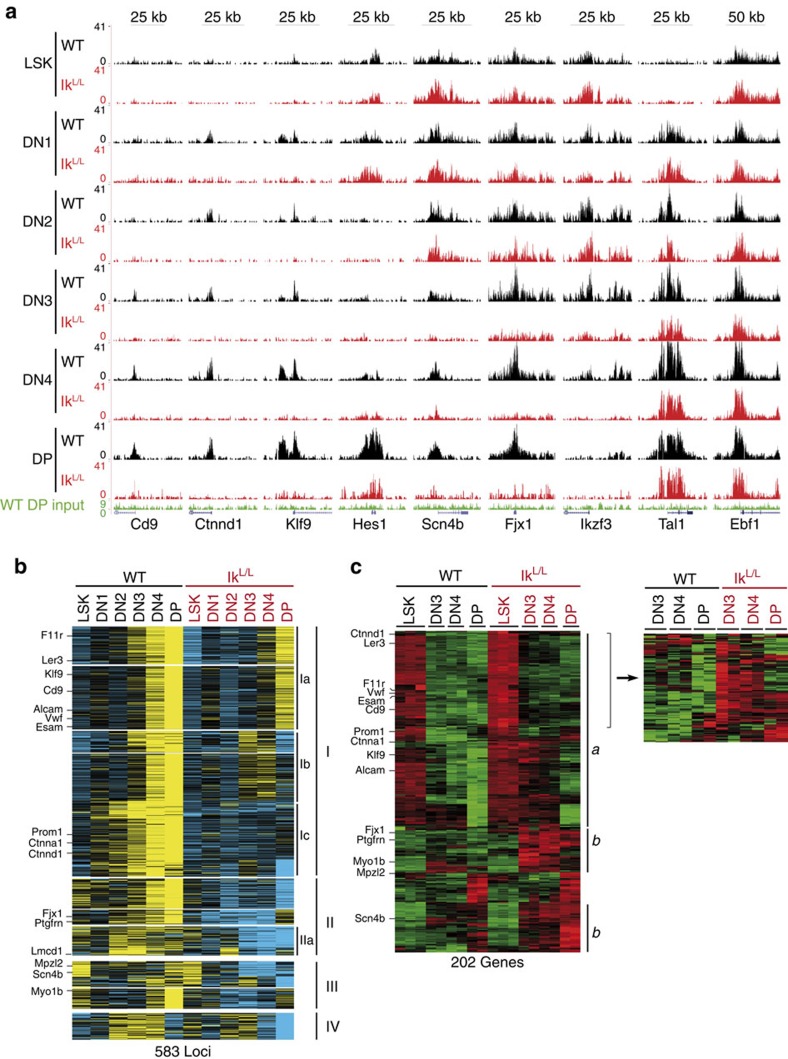
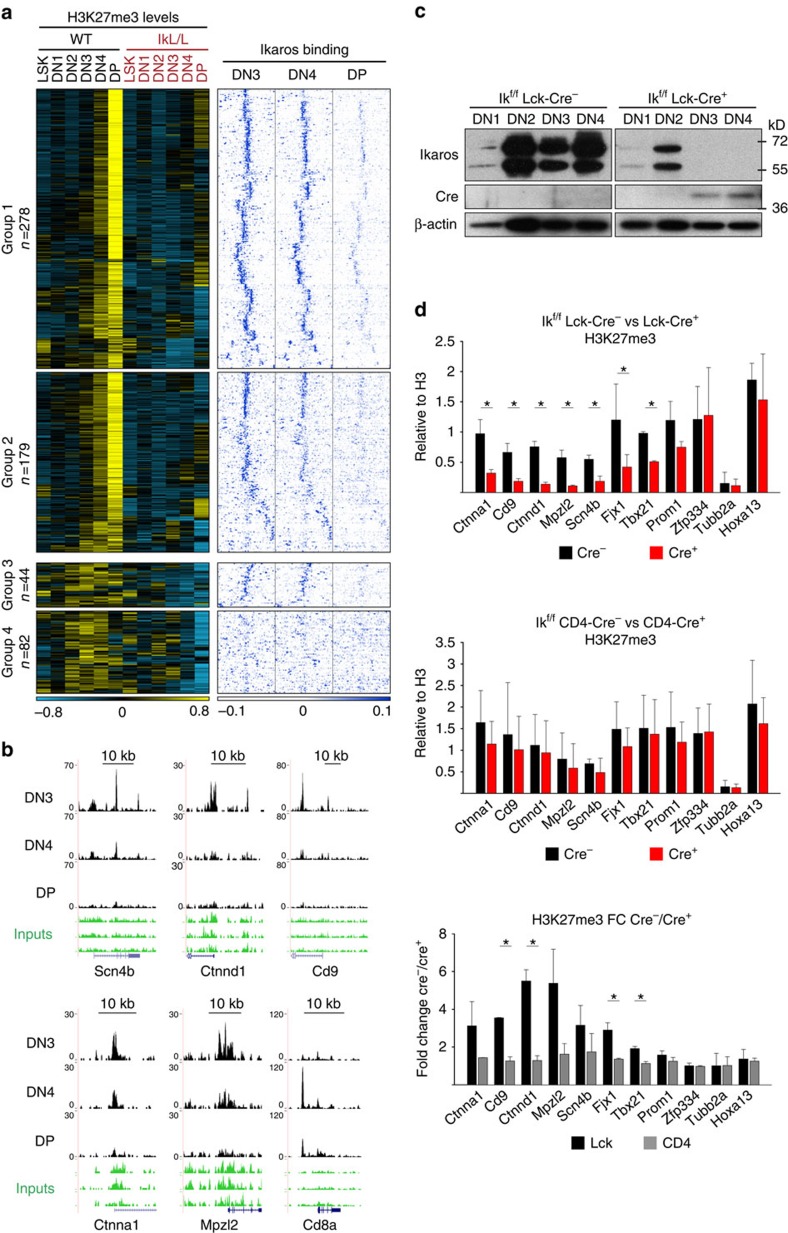
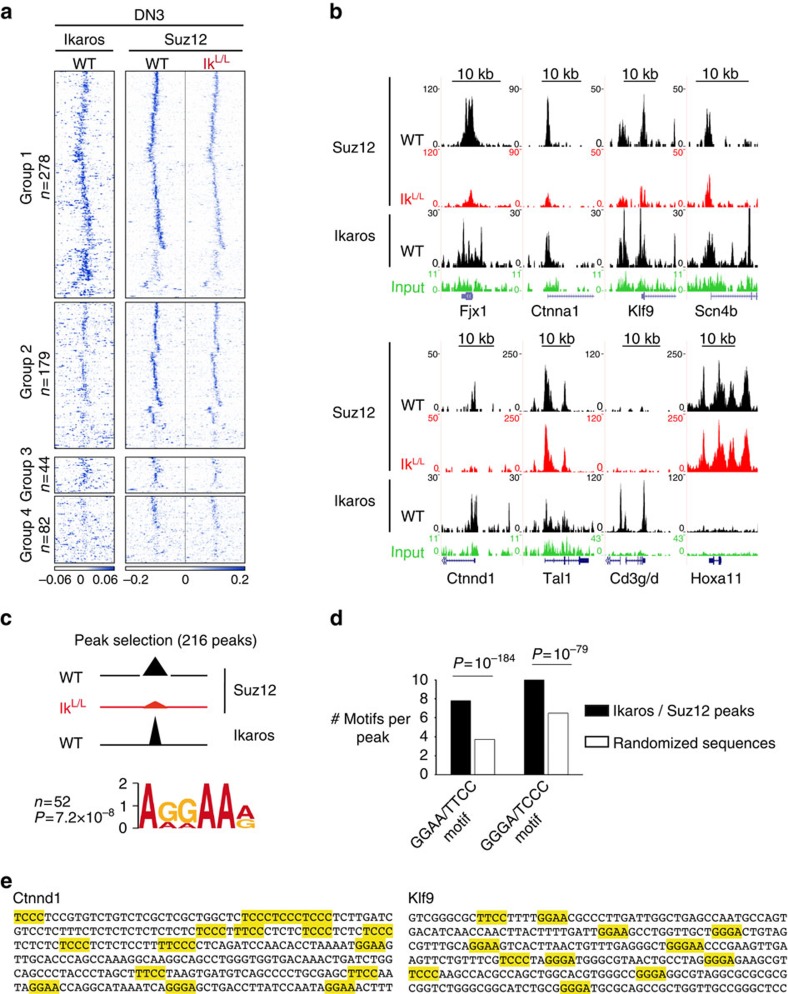
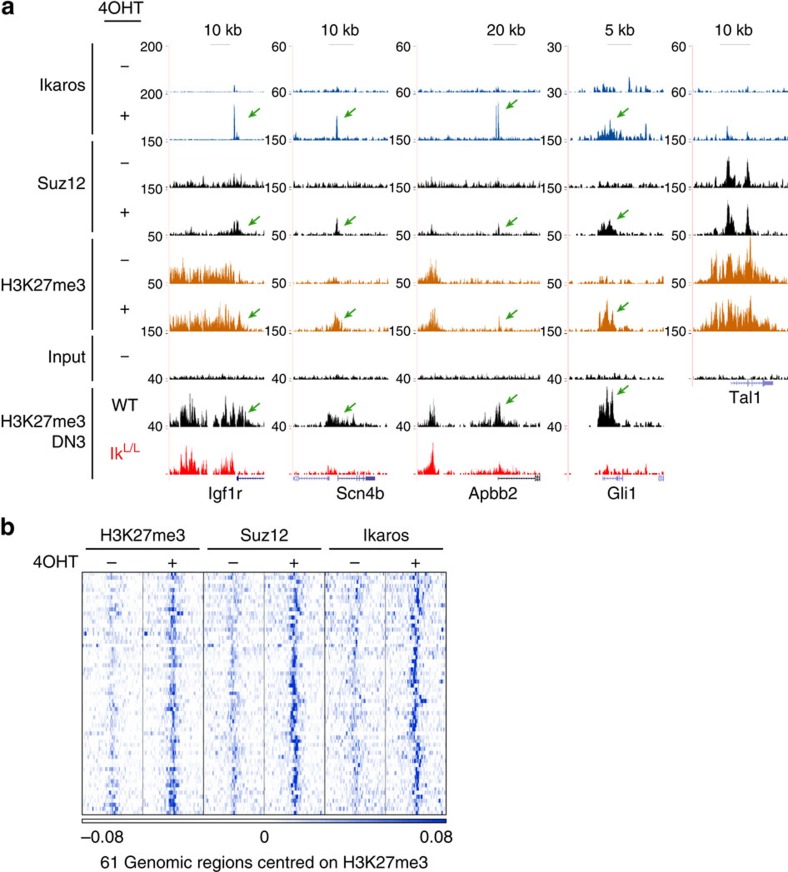
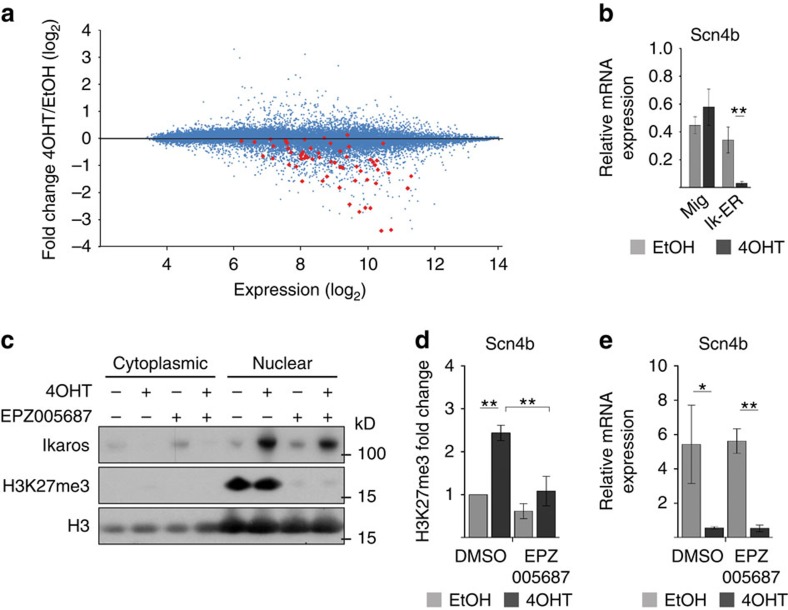
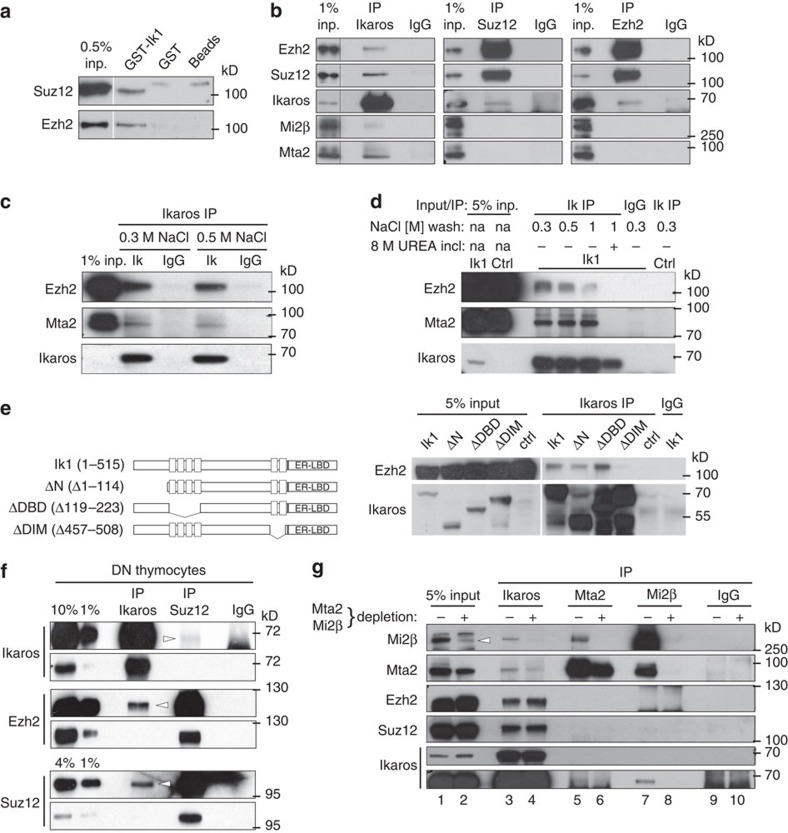
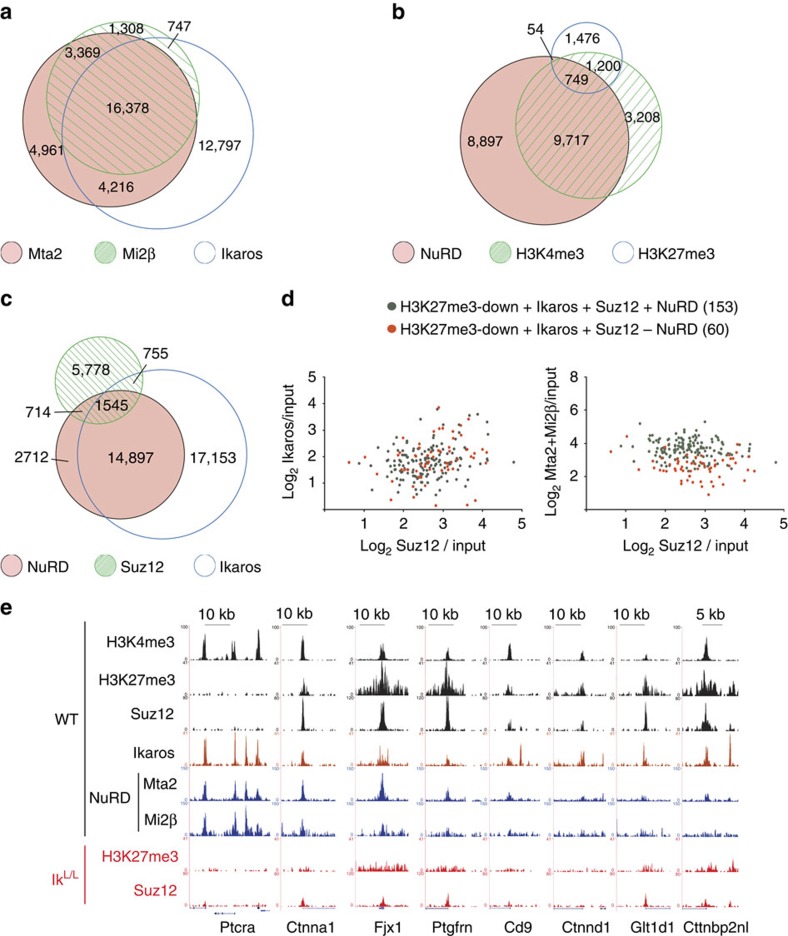
T-cell development is accompanied by epigenetic changes that ensure the silencing of stem cell-related genes and the activation of lymphocyte-specific programmes. How transcription factors influence these changes remains unclear. We show that the Ikaros transcription factor forms a complex with Polycomb repressive complex 2 (PRC2) in CD4(-)CD8(-) thymocytes and allows its binding to more than 500 developmentally regulated loci, including those normally activated in haematopoietic stem cells and others induced by the Notch pathway. Loss of Ikaros in CD4(-)CD8(-) cells leads to reduced histone H3 lysine 27 trimethylation and ectopic gene expression. Furthermore, Ikaros binding triggers PRC2 recruitment and Ikaros interacts with PRC2 independently of the nucleosome remodelling and deacetylation complex. Our results identify Ikaros as a fundamental regulator of PRC2 function in developing T cells.


Figures

Figure 1
Figure 1. Impaired H3K27 trimethylation is a major defect in IkL/L DP thymocytes.
(a) Scatter plots showing the IkL/L/WT log2 fold changes of the indicated histone modifications in DP cells. ChIP-seq tag counts in WT and IkL/L are shown. Red/green values indicate the total number of chromatin marks that are >1.8 × decreased/increased in the mutant. Dots highlighted in the same colours represent the corresponding individual islands. The circled area highlights decreased regions with high tag counts in WT cells. (b) Venn diagram showing the overlap between genomic regions with decreased H3K27me3 or increased H3K4me3 in IkL/L DP thymocytes. The blue-coloured heatmap shows k-means clustering of the tag densities of the corresponding genomic regions for each group. The central stripe schematizes the genomic positions of the islands, with yellow, orange and black indicating promoter, intragenic and intergenic regions, respectively. The log2 expression (left) or log2 fold change (FC, right) of the matched genes is shown in the red–green heatmaps. Transcriptome data are from GSE 46090 (ref. 5). Black lines indicate intergenic regions and light blue lines indicate genes that were not represented on the microarray. For genes with multiple probe sets, we calculated a score corresponding to the product of the expression and FC values for each probe set, and selected the probe set with the highest score. (c) Representative UCSC Genome browser track of H3K27me3 and H3K4me3 ChIP-seq in WT and IkL/L cells. Cd3d and the HoxA cluster served as positive controls for the H3K4me3 and H3K27me3 tracks, respectively. (d) H3K27me3 and Suz12 ChIP–qPCRs from WT and IkL/L cells. The x axes indicate primer pair positions relative to the TSS of the test (Mpzl2, Ctnna1, Ctnnd1 and Cd9) and control (Cd3d and Hoxa13) genes. % input=[(ab ChIP)-(IgG ChIP)]/1% input. Error bars, s.d.; *P<0.05, **P<0.01 (two-sample t-test); n=3–6 and n=2–3 for H3K27me3 and Suz12, respectively.
Figure 2
Figure 2. Ikaros is required for the establishment and maintenance of H3K27me3 in developing T cells.
(a) Genome browser tracks of H3K27me3 ChIP-seq data from WT and IkL/L cells. (b) k-means clustering of relative normalized tag numbers (the region's normalized tag count/length of the region) in H3K27me3 enriched merged genomic regions from the indicated populations. Five hundred and eighty-three loci with >1.8 × decreased normalized tag count in at least one IkL/L population are shown. Blue and yellow represent low and high levels of H3K27me3, respectively. (c) k-means clustering of microarray data from the indicated populations showing 297 probe sets (202 genes) associated with decreased H3K27me3 (>1.8 × ) and an expression change of >4 × between the lowest and highest value of the analysed samples. The right panel shows clustering without the LSK data of part of cluster a. Green and red represent low and high levels of gene expression, respectively.
Figure 3
Figure 3. Ikaros binds to target genes and regulates H3K27me3 in DN3 cells.
(a) Comparison of H3K27me3 profiles and Ikaros binding. The 583 H3K27me3 islands from Fig. 2 were first divided into those with increasing H3K27me3 from the DN3 to DP stage (groups 1 and 2) or not (groups 3 and 4). They were then further divided into groups with significant Ikaros binding (P≤10−7; groups 1 and 3) or not (groups 2 and 4). The H3K27me3 profiles of each group were clustered (k-means, left panels). Tag density heatmaps of the Ikaros ChIP-seq data centred around the corresponding H3K27me3 islands (±10 kb) were calculated for each group and clustered (k-means; right panels). (b) Representative genome browser tracks showing Ikaros binding. (c) Deletion of Ikaros in DN3 cells. Immunoblots of whole-cell lysates from DN1 (2 × 10⁴) and DN2–4 (5 × 10⁴) cells from Ikf/f Lck-Cre and Ikf/f Lck-Cre+ mice. The two bands detected with the anti-Ikaros antibody represent the predominant Ik1 and Ik2 isoforms. Representative of three independent experiments. (d) Ikaros deletion in DN3, but not DP, cells results in the loss of H3K27me3 at Ikaros target genes. Hoxa13 and Tubb2a are positive and negative controls, respectively. H3K27me3 ChIP–qPCRs on chromatin from DP cells of Ikf/f Lck-Cre versus Ikf/f Lck-Cre+ (n=2), Ikf/f CD4-Cre versus Ikf/f CD4-Cre+ (n=2) mice. The values indicate [(H3K27me3 ChIP)-(IgG ChIP)]/[(H3 ChIP)-(IgG ChIP)]. Cre over Cre+ fold changes are shown at the bottom. Error bars, s.d.; *P<0.05 (two-sample t-test).
Figure 4
Figure 4. Ikaros is required for PRC2 targeting in DN3 cells.
(a) k-means clustering of Ikaros and Suz12 tag density heatmaps on the 583 regions that showed decreased H3K27me3 in IkL/L DN3 cells. Groups 1–4 are identical to those in Fig. 3a. (b) Representative genome browser tracks showing Suz12 and Ikaros ChIP-seq in WT and IkL/L cells. WT DP input controls in green. (c) The Ikaros peaks associated with the 216 Suz12 peaks (from Supplementary Fig. 5b left) were selected and motif enrichment near the peak centre (±40 bp from the summit) was analysed with MEME. The AGGAA motif was significantly enriched. (d) Enrichment of the GGGA and GGAA motifs near the Ikaros/Suz12 peaks. The average number of GGGA and GGAA motifs (or their complementary motifs) were determined within 150 bp of the peak summits defined in Supplementary Fig. 5b, as well as in nucleotide sequences of randomized permutations. The P-value was calculated with the χ2-test. (e) Examples of sequences where the putative Ikaros target motifs GGGA and GGAA have been highlighted.
Figure 5
Figure 5. Ikaros induces PRC2 targeting and H3K27 trimethylation.
ChIP-seq of Ikaros, Suz12 and H3K27me3 on ILC87-Ik1-ER cells treated with 4OHT (+) or ethanol (−) for 1 day (Ikaros) or 3 days (Suz12 and H3K27me3). (a) Representative genome browser tracks. Green arrows depict induced Ikaros, Suz12 and H3K27me3. Corresponding H3K27me3 tracks from primary WT and IkL/L DN3 thymocytes are shown at the bottom. Tal1 is shown as positive control. Vertical scales indicate tag numbers. (b) k-means clustering of H3K27me3-centred (±10 kb) Ikaros, Suz12 and H3K27me3 tag density heatmaps on the 61 regions with increased H3K27me3 in 4OHT-treated samples. Selected regions were identified bioinformatically (as having an Ikaros peak in 4OHT-treated cells, which overlapped with a H3K27me3 island that increased >1.8 × between ethanol- and 4OHT-treated cells), or by visual scanning of the tracks.
Figure 6
Figure 6. Impact of Ikaros-induced PRC2 activity on gene expression.
(a) MA plot depicting the expression (in ethanol-treated samples) versus fold change of all the probe sets of the Mouse Gene ST 1.0 array in ILC87-Ik1-ER cells treated with ethanol or 4OHT for 1 day. Probe sets highlighted in red represent the 61 genes with 4OHT-induced H3K27me3 from Fig. 5b. (b) Reverse transcriptase–qPCR (RT–qPCR) analysis of Scn4b expression in ILC87-Ik1-ER and control (Mig) cells treated with ethanol or 4OHT for 1 day. (c) Western blotting of H3K27me3 and Ikaros in ILC87-Ik1-ER cells treated with the Ezh2 inhibitor EPZ005687 or vehicle (dimethyl sulphoxide (DMSO)) for 2 days. During day 2, cells were also treated with 4OHT or ethanol. Histone H3 is shown as loading control. (d,e) H3K27me3 ChIP–qPCR (d) and RT–qPCR (e) analysis of the Scn4b gene in cells treated as in c. Expression data are normalized to Hprt. Error bars, s.d. (n=3); *P<0.05, **P<0.01 (two-sample t-test).
Figure 7
Figure 7. Ikaros forms a complex with PRC2 independent of NuRD.
(a) GST-Ikaros binds PRC2. Bacterially expressed Ik1-GST fusion protein was immobilized on glutathione-agarose beads and incubated with ILC87 nuclear extracts. Bound proteins were analysed by western blotting. Immobilized GST protein alone, or glutathione-agarose beads alone were used as negative controls. (b) Ikaros interacts with PRC2 in ILC87 cells. Western blottings for the indicated proteins after IP of Ikaros, Suz12, Ezh2 or IgG. One per cent inputs from the nuclear extracts of ILC87-Ik1-Bcl2 cells are shown. (c) Western blottings for the indicated proteins after IP of Ikaros (Ik) or IgG from nuclear extracts as in b, except that the IPs and washing steps were performed in the presence of 0.3 or 0.5 M NaCl as indicated. (d) Ikaros (Ik) or IgG IPs from nuclear extracts as in b. Immune complexes were washed in the presence of 0.3, 0.5 or 1 M NaCl, or 1 M NaCl plus 8 M urea, as indicated. The ctrl sample is an Ikaros IP performed on nuclear extracts of ILC87-Bcl2 cells transduced with the empty MigR1 vector. Five per cent inputs are shown. (e) Right: analysis of the interaction of Ikaros deletion mutants with Ezh2 by co-IP. As in b, except that ILC87-Bcl2 cells expressing the indicated Ikaros mutants were analysed. Five per cent input controls are shown. Left: schematic representation of the Ikaros deletion constructs. (f) Ikaros interacts with PRC2 in primary WT DN cells. Western blottings for the indicated proteins after IP of Ikaros, Suz12 or IgG on ∼333 μg nuclear extracts from WT CD4CD8CD3 thymocytes. (g) NuRD depletion does not affect the Ikaros–PRC2 interaction. Nuclear extracts of ILC87-Ik1-Bcl2 cells were incubated in three consecutive steps with IgG- (−), or anti-Mta2- and anti-Mi2β-coupled (+), Protein A/G Sepharose beads. Resulting supernatants (shown as 5% inputs) were subjected to Ikaros, Mta2, Mi2β or IgG IPs and immunoblotted as indicated. Arrowhead indicates the Mi2β-specific signal. Short and long exposures of the Ikaros blot are shown. (b) Representative of ≥5, (c) 1, (d) 2, (a,eg) 3 independent experiments.
Figure 8
Figure 8. Ikaros and PRC2 co-localize at genomic regions devoid of NuRD.
ChIP-seq analysis of Mta2, Mi2β, H3K4me3 and H3K27me3 (Fig. 2), Ikaros (Fig. 3) and Suz12 (Fig. 4) in WT DN3 thymocytes. Venn diagrams of (a) 43,776 merged genomic regions bound by Mta2, Mi2β and Ikaros; (b) 25,301 merged genomic regions occupied by NuRD (that is, Mta2 and Mi2β), H3K4me3 and H3K27me3; (c) 43,554 merged genomic regions bound by NuRD, Ikaros and Suz12. It is noteworthy that each merged genomic region may comprise several overlapping binding sites from the different samples. (d) Scatter plot comparisons of Ikaros (left) and NuRD (right) binding to 213 Suz12- and Ikaros-bound regions that exhibit decreased H3K27me3 in IkL/L thymocytes (Supplementary Fig. S6b,c; it is noteworthy that 3 of the 213 common Ikaros/Suz12-bound regions considered here had 2 distinct Suz12 peaks, of which only the ones with higher tag numbers were kept for this analysis). Binding intensities are expressed as log2 FC over input. Regions bound or not by NuRD are shown in grey and red, respectively. (e) Representative genome browser tracks illustrating occupancy by Ikaros, Suz12 and NURD, as well as H3K4me3 and H3K27me3 levels of selected loci. H3K27me3 and Suz12 tracks from IkL/L DN3 thymocytes are shown at the bottom. The Ptcra locus is shown as an active gene with high levels of NURD, Ikaros and H3K4me3.

References

    1. Zhang J. A., Mortazavi A., Williams B. A., Wold B. J. & Rothenberg E. V. Dynamic transformations of genome-wide epigenetic marking and transcriptional control establish T cell identity. Cell 149, 467–482 (2012). - PMC - PubMed
    1. Mingueneau M. et al.. The transcriptional landscape of alphabeta T cell differentiation. Nat. Immunol. 14, 619–632 (2013). - PMC - PubMed
    1. Vigano M. A. et al.. An epigenetic profile of early T-cell development from multipotent progenitors to committed T-cell descendants. Eur. J. Immunol. 44, 1181–1193 (2014). - PubMed
    1. Ng S. Y., Yoshida T., Zhang J. & Georgopoulos K. Genome-wide lineage-specific transcriptional networks underscore Ikaros-dependent lymphoid priming in hematopoietic stem cells. Immunity 30, 493–507 (2009). - PMC - PubMed
    1. Geimer Le Lay A. S. et al.. The tumor suppressor Ikaros shapes the repertoire of Notch target genes in T cells. Sci. Signal. 7, ra28 (2014). - PubMed

Publication types

MeSH terms