

MRI biomarker assessment of neuromuscular disease progression: a prospective observational cohort study
- PMID: 26549782
- PMCID: PMC4672173
- DOI: 10.1016/S1474-4422(15)00242-2
MRI biomarker assessment of neuromuscular disease progression: a prospective observational cohort study
Abstract
Background: A substantial impediment to progress in trials of new therapies in neuromuscular disorders is the absence of responsive outcome measures that correlate with patient functional deficits and are sensitive to early disease processes. Irrespective of the primary molecular defect, neuromuscular disorder pathological processes include disturbance of intramuscular water distribution followed by intramuscular fat accumulation, both quantifiable by MRI. In pathologically distinct neuromuscular disorders, we aimed to determine the comparative responsiveness of MRI outcome measures over 1 year, the validity of MRI outcome measures by cross-sectional correlation against functionally relevant clinical measures, and the sensitivity of specific MRI indices to early muscle water changes before intramuscular fat accumulation beyond the healthy control range.
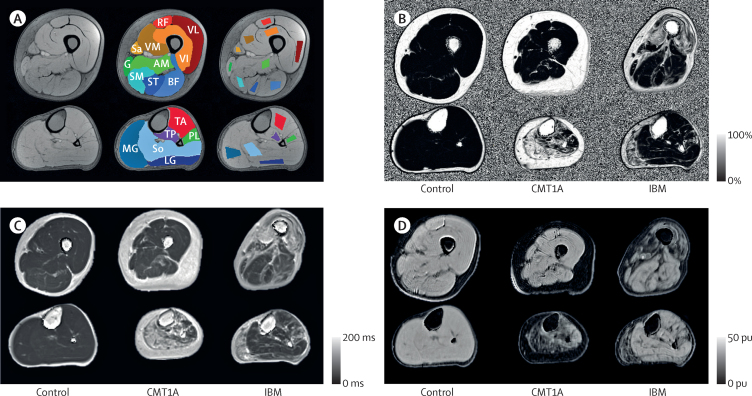
Methods: We did a prospective observational cohort study of patients with either Charcot-Marie-Tooth disease 1A or inclusion body myositis who were attending the inherited neuropathy or muscle clinics at the Medical Research Council (MRC) Centre for Neuromuscular Diseases, National Hospital for Neurology and Neurosurgery, London, UK. Genetic confirmation of the chromosome 17p11.2 duplication was required for Charcot-Marie-Tooth disease 1A, and classification as pathologically or clinically definite by MRC criteria was required for inclusion body myositis. Exclusion criteria were concomitant diseases and safety-related MRI contraindications. Healthy age-matched and sex-matched controls were also recruited. Assessments were done at baseline and 1 year. The MRI outcomes-fat fraction, transverse relaxation time (T2), and magnetisation transfer ratio (MTR)-were analysed during the 12-month follow-up, by measuring correlation with functionally relevant clinical measures, and for T2 and MTR, sensitivity in muscles with fat fraction less than the 95th percentile of the control group.
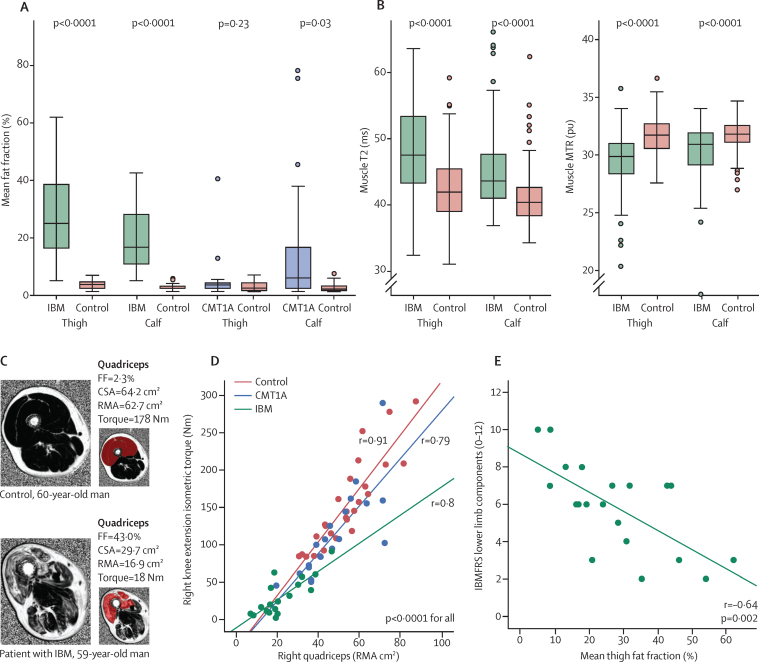
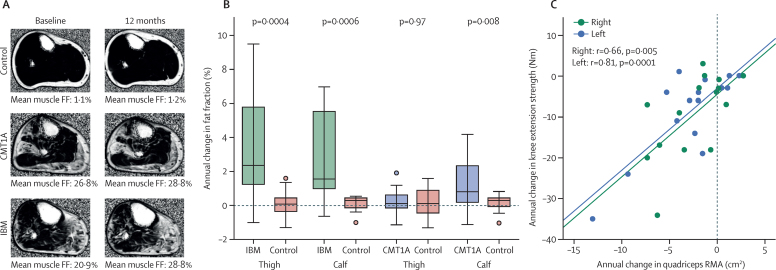
Findings: Between Jan 19, 2010, and July 7, 2011, we recruited 20 patients with Charcot-Marie-Tooth disease 1A, 20 patients with inclusion body myositis, and 29 healthy controls (allocated to one or both of the 20-participant matched-control subgroups). Whole muscle fat fraction increased significantly during the 12-month follow-up at calf level (mean absolute change 1.2%, 95% CI 0.5-1.9, p=0.002) but not thigh level (0.2%, -0.2 to 0.6, p=0.38) in patients with Charcot-Marie-Tooth disease 1A, and at calf level (2.6%, 1.3-4.0, p=0.002) and thigh level (3.3%, 1.8-4.9, p=0.0007) in patients with inclusion body myositis. Fat fraction correlated with the lower limb components of the inclusion body myositis functional rating score (ρ=-0.64, p=0.002) and the Charcot-Marie-Tooth examination score (ρ=0.63, p=0.003). Longitudinal T2 and MTR changed consistently with fat fraction but more variably. In muscles with a fat fraction lower than the control group 95th percentile, T2 was increased in patients compared with controls (regression coefficients: inclusion body myositis thigh 4.0 ms [SE 0.5], calf 3.5 ms [0.6]; Charcot-Marie-Tooth 1A thigh 1.0 ms [0.3], calf 2.0 ms [0.3]) and MTR reduced compared with controls (inclusion body myositis thigh -1.5 percentage units [pu; 0.2], calf -1.1 pu [0.2]; Charcot-Marie-Tooth 1A thigh -0.3 pu [0.1], calf -0.7 pu [0.1]).
Interpretation: MRI outcome measures can monitor intramuscular fat accumulation with high responsiveness, show validity by correlation with conventional functional measures, and detect muscle water changes preceding marked intramuscular fat accumulation. Confirmation of our results in further cohorts with these and other muscle-wasting disorders would suggest that MRI biomarkers might prove valuable in experimental trials.
Funding: Medical Research Council UK.
Copyright © 2016 Morrow et al. Open Access article distributed under the terms of CC BY 4.0. Published by Elsevier Ltd.. All rights reserved.
Figures

Comment in
-
MRI quantifies neuromuscular disease progression.Lancet Neurol. 2016 Jan;15(1):26-8. doi: 10.1016/S1474-4422(15)00320-8. Epub 2015 Nov 6. Lancet Neurol. 2016. PMID: 26549781 Free PMC article. No abstract available.
References
-
- Braathen GJ. Genetic epidemiology of Charcot-Marie-Tooth disease. Acta Neurol Scand Suppl. 2012;193:iv–22. - PubMed
-
- Arechavala-Gomeza V, Anthony K, Morgan J, Muntoni F. Antisense oligonucleotide-mediated exon skipping for Duchenne muscular dystrophy: progress and challenges. Curr Gene Ther. 2012;12:152–160. - PubMed
-
- Verhamme C, van Schaik IN, Koelman JHTM, de Haan RJ, de Visser M. The natural history of Charcot-Marie-Tooth type 1A in adults: a 5-year follow-up study. Brain. 2009;132:3252–3262. - PubMed
-
- Liang MH, Fossel AH, Larson MG. Comparisons of five health status instruments for orthopedic evaluation. Med Care. 1990;28:632–642. - PubMed
Publication types
MeSH terms
Substances
Grants and funding
LinkOut - more resources
Full Text Sources
Other Literature Sources
Medical
