. 2015 Nov 1:62:131-149.
doi: 10.1016/j.apgeochem.2015.01.005. Epub 2015 Feb 7.

Toxic metal(loid) speciation during weathering of iron sulfide mine tailings under semi-arid climate

Affiliations

Toxic metal(loid) speciation during weathering of iron sulfide mine tailings under semi-arid climate

Robert A Root et al. Appl Geochem. .

Abstract

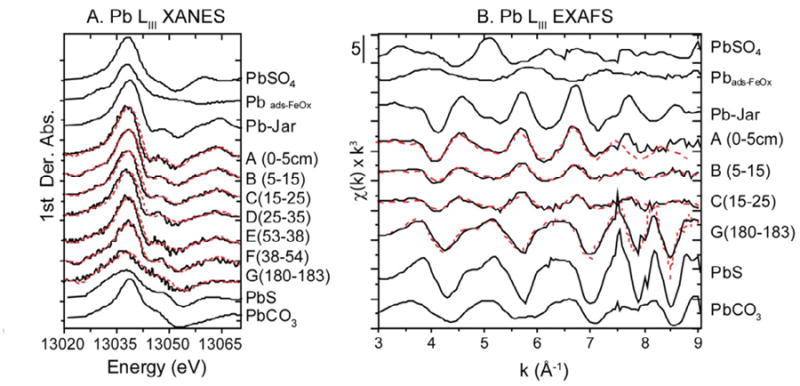
Toxic metalliferous mine-tailings pose a significant health risk to ecosystems and neighboring communities from wind and water dispersion of particulates containing high concentrations of toxic metal(loid)s (e.g., Pb, As, Zn). Tailings are particularly vulnerable to erosion before vegetative cover can be reestablished, i.e., decades or longer in semi-arid environments without intervention. Metal(loid) speciation, linked directly to bioaccessibility and lability, is controlled by mineral weathering and is a key consideration when assessing human and environmental health risks associated with mine sites. At the semi-arid Iron King Mine and Humboldt Smelter Superfund site in central Arizona, the mineral assemblage of the top 2 m of tailings has been previously characterized. A distinct redox gradient was observed in the top 0.5 m of the tailings and the mineral assemblage indicates progressive transformation of ferrous iron sulfides to ferrihydrite and gypsum, which, in turn weather to form schwertmannite and then jarosite accompanied by a progressive decrease in pH (7.3 to 2.3). Within the geochemical context of this reaction front, we examined enriched toxic metal(loid)s As, Pb, and Zn with surficial concentrations 41.1, 10.7, 39.3 mM kg-1 (3080, 2200, and 2570 mg kg-1), respectively. The highest bulk concentrations of As and Zn occur at the redox boundary representing a 1.7 and 4.2 fold enrichment relative to surficial concentrations, respectively, indicating the translocation of toxic elements from the gossan zone to either the underlying redox boundary or the surface crust. Metal speciation was also examined as a function of depth using X-ray absorption spectroscopy (XAS). The deepest sample (180 cm) contains sulfides (e.g., pyrite, arsenopyrite, galena, and sphalerite). Samples from the redox transition zone (25-54 cm) contain a mixture of sulfides, carbonates (siderite, ankerite, cerrusite, and smithsonite) and metal(loid)s sorbed to neoformed secondary Fe phases, principally ferrihydrite. In surface samples (0-35 cm), metal(loid)s are found as sorbed species or incorporated into secondary Fe hydroxysulfate phases, such as schwertmannite and jarosites. Metal-bearing efflorescent salts (e.g., ZnSO4·nH2O) were detected in the surficial sample. Taken together, these data suggest the bioaccessibility and lability of metal(loid)s are altered by mineral weathering, which results in both the downward migration of metal(loid)s to the redox boundary, as well as the precipitation of metal salts at the surface.

Keywords: XAS; arsenic; lead; mine tailing; semi-arid; zinc.


Figures

Figure 1
Figure 1
Chemical depletion/enrichment plots showing Ti normalized As, Pb, and Zn mass concentrations in the weathering profile relative to parent material taken as 180 cm sample (see Eq. 2). The horizontal dashed-line represents the redox boundary, whereas the shaded region shows relative depletion.
Figure 2
Figure 2
Sequential extraction results for As, Pb, and Zn extractable concentrations in the weathering profile as a function of depth (see online version for color coding). Results in Table S3.
Figure 3
Figure 3
Arsenic K-edge XAS of IKMHSS tailings compared with reference compounds. Solid black lines are data; stippled red lines are least-squares best fits; (A) XANES, (B) unfiltered k3 weighted EXAFS, and (C) uncorrected for phase shift Fourier transformed EXAFS (FT). Model compounds are shown in blue (see electronic version for color). The vertical band in (A) show reference FeAsS and lines point out As(III)-O and As(V)-O; vertical lines and arrows in (C) highlight the structural features corresponding to the calculated coordination and distance, explained in the text. (A) XANES shows the fit deconvolution with reference arsenopyrite, As(III)–O, and As(V)–O spectra (fit results in Table 3). EXAFS fit results are given in Table 4.
Figure 4
Figure 4
Least-squares linear combination fits of Pb LIII in IKMHSS tailings (A) first-derivative XANES, (B) EXAFS. Data are shown by solid black lines and fits are shown by stippled red line. The spectra show that Pb in the tailings weathers from galena to primarily plumbojarosite, but the near surface surficial tailings are enriched in sorbed Pb where pH is >3.
Figure 5
Figure 5
Normalized Zn K-edge XANES collected at 8-15 K for (A) of IKMHSS tailings, and (B) normalized Zn reference compounds: ZnSO4=goslarite, Zn-jar =Zn sorbed jarosite, Zn-hem =Zn sorbed hematite, smithsonite = ZnCO3, and sphalerite = ZnS (see SM for source and synthesis methods for reference compounds). Data are shown by solid black lines and fits are shown by stippled red line. The XANES fits show that Zn in the tailings weathers from sphalerite to primarily jarosite-adsorbed Zn and goslarite at the surface.
Figure 6
Figure 6
Elemental maps analyzed by μXRF from composited 0-25 cm IKMHSS tailings for S, Fe, As, Pb, Zn, Ca, Cu, K, Si, and Ti. Intensity (black is low, white is high) reported in normalized counts (cts) correlates to concentration with the range (0 – maximum) given at each panel.
Figure 7
Figure 7
μXRF elemental association maps from 30 μm double polished petrographic thin section from composited 0-25 cm IKMHSS tailings from Fig 6. A.) Ca and S with inset (a) showing grain in Fig. 8. B.) Intensity of isolated sulfide components operationally-defined by masking region of high S and no Ca, encircled in the S v Ca correlation plot. C.) As, Fe and Pb elemental associations, spot (b) refers to the high Fe low S region, (c) and (d) are Pb LIII μXANES spots with fits shown in Figure 6 (spots μ-7 and μ-8), fits in and Table 5; D.) relative As concentration (see electronic version for color). Labels on masked regions of correlation plots indicate likely phases based on elemental associations.
Figure 8
Figure 8
Panels (A) show μXRF elemental intensity images for Fe, As, S and Ca from pyrite grain in Fig. 6 and 7, each map is optimized from minimum to maximum fluorescence counts (black to white); Fe (0-7500 cts), As (0-900 cts), S (0-125 cts), Ca (0-625 cts). Markers 1-5 indicate As μXANES spots across an As(V) rind on a pyrite grain. (B) As K-edge normalized and first derivative μXANES across the pyrite grain. Model compounds are shown in gray lines. The vertical bands show reference FeAsS and lines point out As(III)-O and As(V)-O (gray); fit results in Table 3.
Figure 9
Figure 9
Multiple energy μXRF maps of (A) As species and (B) Fe mineralogy from 30 μm double polished petrographic thin section from sample D.
Figure 10
Figure 10
Equilibrium phase relations calculated for total element activities representative of the study site. Eh–pH predominance diagram showing equilibrium among aqueous (un-shaded) and solid phase (shaded) (A) for As; (B) Pb; (C) and Zn at (Fe)total = 10-3.5, (S)total = 10-3.5, (As)total = 10-6, (Pb)total = 10-6, (Zn)total = 10-6. Phase relations among dissolved species and solid phases calculated for the same system as a function of Eh and pH at 25°C and 1 atm, thermodynamic data sources detailed in section 2.8. The hatched area bounds the measured pH at the IKMHSS site and highlights the stability fields. Orpiment and realgar, which were not observed with XAS or XRD, were suppressed in the calculation.

References

    1. Alpers CN, Brimhall GH. Middle Miocene climatic change in the Atacama Desert, northern Chile: Evidence from supergene mineralization at La Escondida. Geological Society of America Bulletin. 1988;100:1640–1656.
    1. Arai Y. Effects of Dissolved Calcium on Arsenate Sorption at the Kaolinite-Water Interface. Soil Science. 2010;175:207–213.
    1. Asta MP, Ayora C, Roman-Ross G, Cama J, Acero P, Gault AG, Charnock JM, Bardelli F. Natural attenuation of arsenic in the Tinto Santa Rosa acid stream (Iberian Pyritic Belt, SW Spain): The role of iron precipitates. Chemical Geology. 2010;271:1–12.
    1. Bacon JR, Davidson CM. Is there a future for sequential chemical extraction? Analyst. 2008;133:25–46. - PubMed
    1. Bandy MC. Mineralogy of three sulphate deposits of northern Chile. American Mineralogist. 1938;23:669–760.

LinkOut - more resources