

PET studies in epilepsy
- PMID: 26550535
- PMCID: PMC4620171
PET studies in epilepsy
Abstract
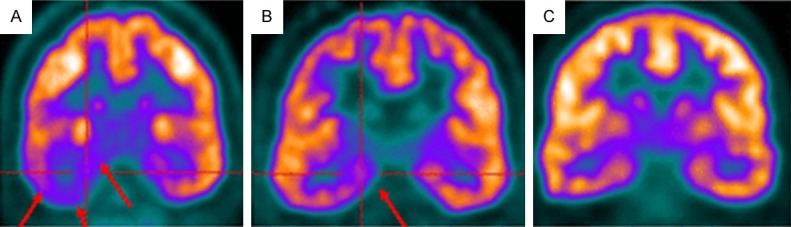
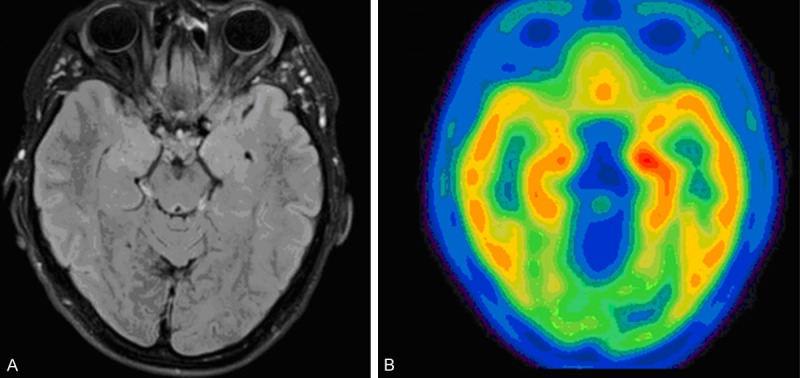
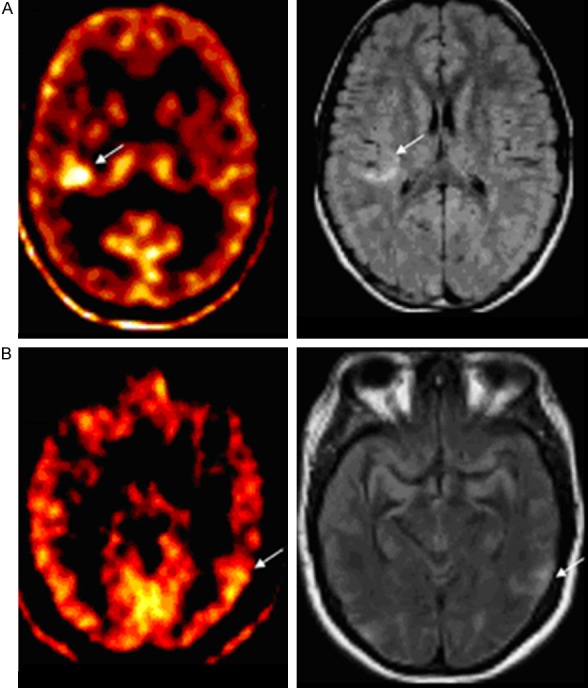
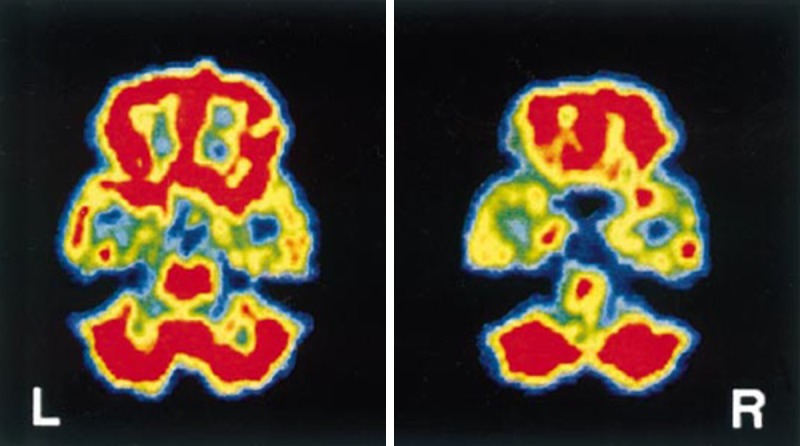
Various PET studies, such as measurements of glucose, serotonin and oxygen metabolism, cerebral blood flow and receptor bindings are availabe for epilepsy. (18)Fluoro-2-deoxyglucose ((18)F-FDG) PET imaging of brain glucose metabolism is a well established and widely available technique. Studies have demonstrated that the sensitivity of interictal FDG-PET is higher than interictal SPECT and similar to ictal SPECT for the lateralization and localization of epileptogenic foci in presurgical patients refractory to medical treatments who have noncontributory EEG and MRI. In addition to localizing epileptogenic focus, FDG-PET provide additional important information on the functional status of the rest of the brain. The main limitation of interictal FDG-PET is that it cannot precisely define the surgical margin as the area of hypometabolism usually extends beyond the epileptogenic zone. Various neurotransmitters (GABA, glutamate, opiates, serotonin, dopamine, acethylcholine, and adenosine) and receptor subtypes are involved in epilepsy. PET receptor imaging studies performed in limited centers help to understand the role of neurotransmitters in epileptogenesis, identify epileptic foci and investigate new treatment approaches. PET receptor imaging studies have demonstrated reduced (11)C-flumazenil (GABAA-cBDZ) and (18)F-MPPF (5-HT1A serotonin) and increased (11)C-cerfentanil (mu opiate) and (11)C-MeNTI (delta opiate) bindings in the area of seizure. (11)C-flumazenil has been reported to be more sensitive than FDG-PET for identifying epileptic foci. The area of abnormality on GABAAcBDZ and opiate receptor images is usually smaller and more circumscribed than the area of hypometabolism on FDG images. Studies have demonstrated that (11)C-alpha-methyl-L-tryptophan PET (to study synthesis of serotonin) can detect the epileptic focus within malformations of cortical development and helps in differentiating epileptogenic from non-epileptogenic tubers in patients with tuberous sclerosis complex. (15)O-H2O PET was reported to have a similar sensitivity to FDG-PET in detecting epileptic foci.
Keywords: Epilepsy; FDG; Neurotransmitter; PET; receptor.
Figures

References
-
- Berg AT, Berkovic SF, Brodie MJ, Buchhalter J, Cross JH, van Emde Boas W, Engel J, French J, Glauser TA, Mathern GW, Moshé SL, Nordli D, Plouin P, Scheffer IE. Revised terminology and concepts for organization of seizures and epilepsies: report of the ILAE Commission on Classification and Terminology, 2005-2009. Epilepsia. 2010;51:676–85. - PubMed
-
- Devous MD Sr, Thisted RA, Morgan GF, Leroy RF, Rowe CC. SPECT brain imaging in epilepsy: a meta-analysis. J Nucl Med. 1998;39:285–93. - PubMed
-
- Spencer SS. The relative contributions of MRI SPECT and PET imaging in epilepsy. Epilepsia. 1994;35:S72–S89. - PubMed
-
- Weil S, Noachtar S, Arnold S, Yousry TA, Winkler PA, Tatsch K. Ictal ECD-SPECT differentiates between temporal and extratemporal epilepsy: confirmation by excellent postoperative seizure control. Nucl Med Commun. 2001;22:233–7. - PubMed
-
- Society of Nuclear Medicine Procedure Guideline for FDG PET Brain Imaging Version 1.0. approved February 8, 2009.
Publication types
LinkOut - more resources
Full Text Sources
Research Materials