

Moving to a Highly Walkable Neighborhood and Incidence of Hypertension: A Propensity-Score Matched Cohort Study
- PMID: 26550779
- PMCID: PMC4892930
- DOI: 10.1289/ehp.1510425
Moving to a Highly Walkable Neighborhood and Incidence of Hypertension: A Propensity-Score Matched Cohort Study
Abstract
Background: The impact of moving to a neighborhood more conducive to utilitarian walking on the risk of incident hypertension is uncertain.
Objective: Our study aimed to examine the effect of moving to a highly walkable neighborhood on the risk of incident hypertension.
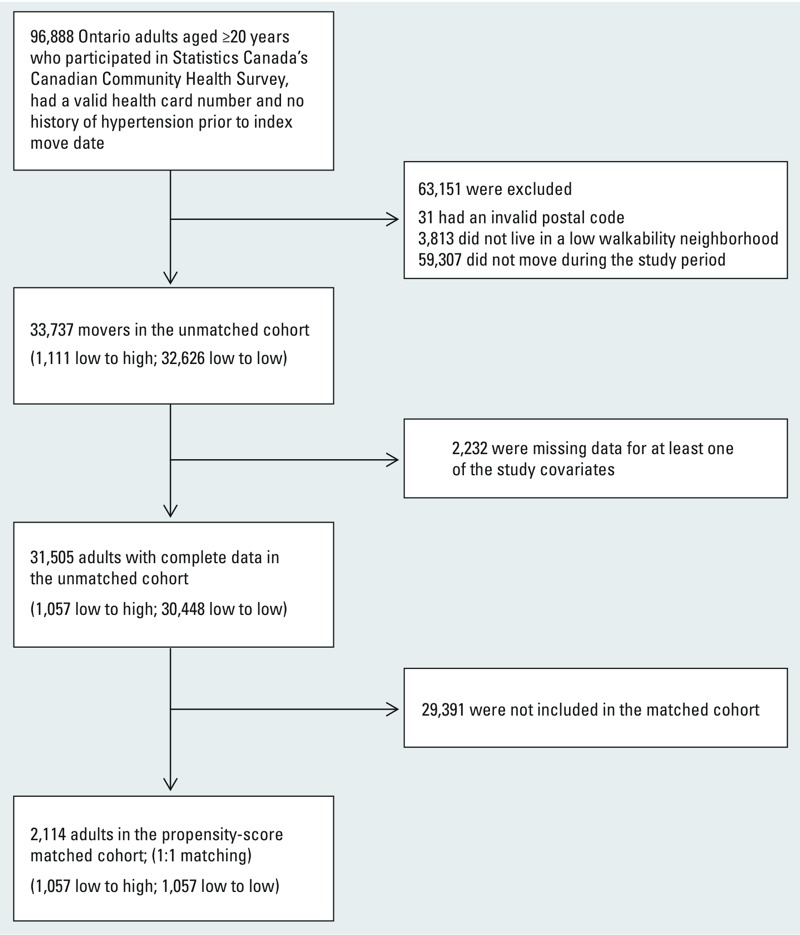
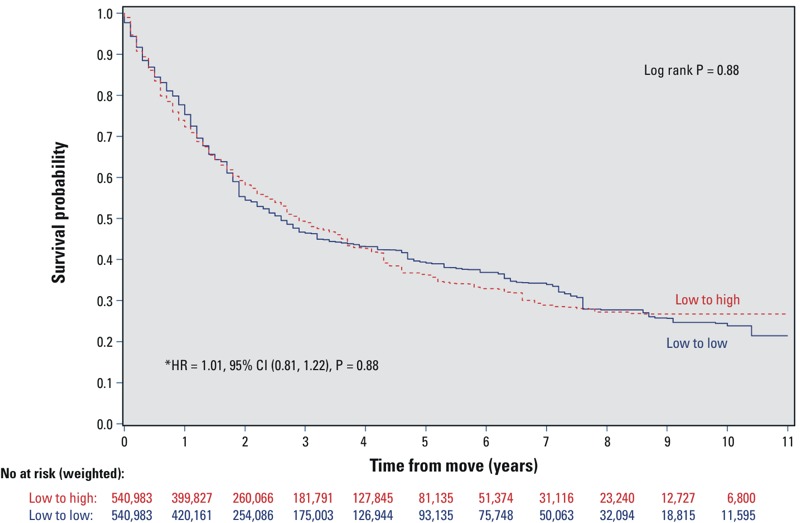
Methods: A population-based propensity-score matched cohort study design was used based on the Ontario population from the Canadian Community Health Survey (2001-2010). Participants were adults ≥ 20 years of age who moved from a low-walkability neighborhood (defined as any neighborhood with a Walk Score < 90) to either a high- (Walk Score ≥ 90) or another low-walkability neighborhood. The incidence of hypertension was assessed by linking the cohort to administrative health databases using a validated algorithm. Propensity-score matched Cox proportional hazard models were used. Annual health examination was used as a control event.
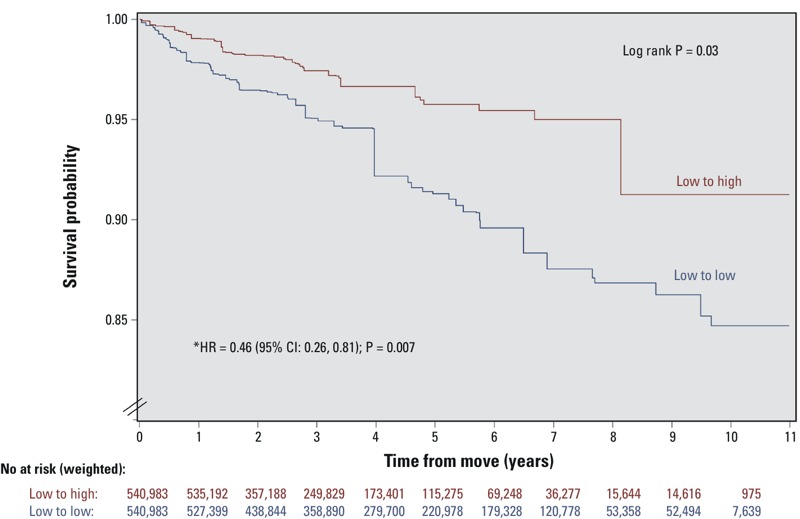
Results: Among the 1,057 propensity-score matched pairs there was a significantly lower risk of incident hypertension in the low to high vs. the low to low-walkability groups [hazard ratio = 0.46; 95% CI, 0.26, 0.81, p < 0.01]. The crude hypertension incidence rates were 18.0 per 1,000 person-years (95% CI: 11.6, 24.8) among the low- to low-walkability movers compared with 8.6 per 1,000 person-years (95% CI: 5.3, 12.7) among the low- to high-walkability movers (p < 0.001). There were no significant differences in the hazard of annual health examination between the two mover groups.
Conclusions: Moving to a highly walkable neighborhood was associated with a significantly lower risk of incident hypertension. Future research should assess whether specific attributes of walkable neighborhoods (e.g., amenities, density, land-use mix) may be driving this relationship.
Citation: Chiu M, Rezai MR, Maclagan LC, Austin PC, Shah BR, Redelmeier DA, Tu JV. 2016. Moving to a highly walkable neighborhood and incidence of hypertension: a propensity-score matched cohort study. Environ Health Perspect 124:754-760; http://dx.doi.org/10.1289/ehp.1510425.
Conflict of interest statement
The study results and conclusions are those of the authors, and should not be attributed to any of the funding or sponsoring agencies. No endorsement by ICES or the Ontario MOHLTC is intended or should be inferred. All decisions regarding study design, publication, and data analysis were made independent of the funding agencies.
The authors declare they have no actual or potential competing financial interests.
Figures
Comment in
-
New Home, New Prognosis? Reduced Hypertension Risk after Moving to a High-Walkability Neighborhood.Environ Health Perspect. 2016 Jun 1;124(6):A112. doi: 10.1289/ehp.124-A112. Environ Health Perspect. 2016. PMID: 27248574 Free PMC article. No abstract available.
References
Publication types
MeSH terms
Grants and funding
LinkOut - more resources
Full Text Sources
Other Literature Sources
Medical