

Normal-Weight Central Obesity: Implications for Total and Cardiovascular Mortality
- PMID: 26551006
- PMCID: PMC4995595
- DOI: 10.7326/M14-2525
Normal-Weight Central Obesity: Implications for Total and Cardiovascular Mortality
Abstract
Background: The relationship between central obesity and survival in community-dwelling adults with normal body mass index (BMI) is not well-known.
Objective: To examine total and cardiovascular mortality risks associated with central obesity and normal BMI.
Design: Stratified multistage probability design.
Setting: NHANES III (Third National Health and Nutrition Examination Survey).
Participants: 15,184 adults (52.3% women) aged 18 to 90 years.
Measurements: Multivariable Cox proportional hazards models were used to evaluate the relationship of obesity patterns defined by BMI and waist-to-hip ratio (WHR) and total and cardiovascular mortality risk after adjustment for confounding factors.
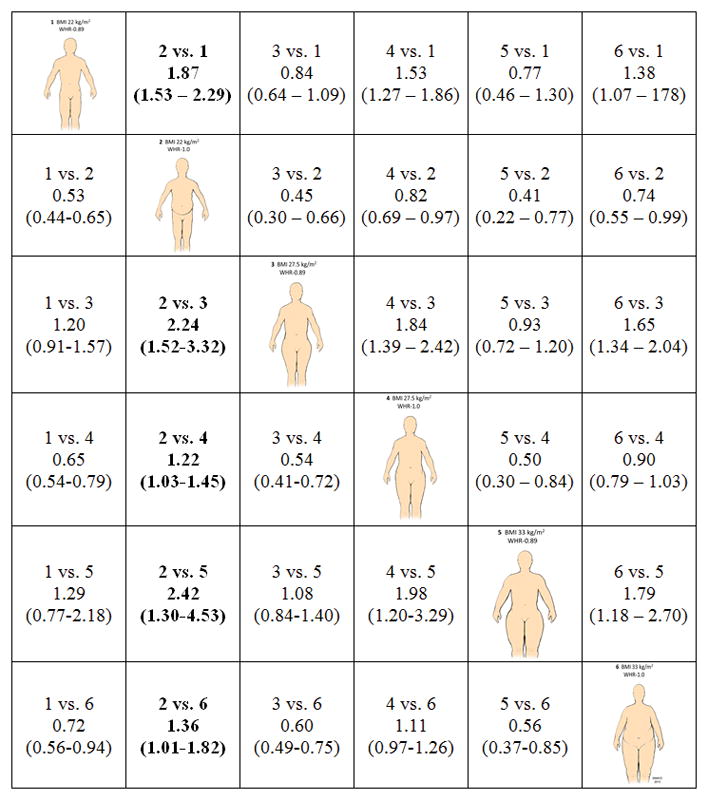
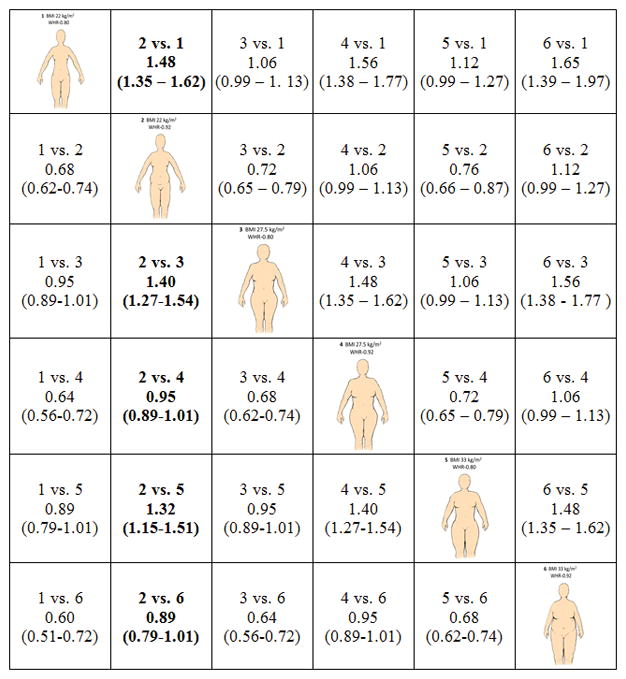
Results: Persons with normal-weight central obesity had the worst long-term survival. For example, a man with a normal BMI (22 kg/m2) and central obesity had greater total mortality risk than one with similar BMI but no central obesity (hazard ratio [HR], 1.87 [95% CI, 1.53 to 2.29]), and this man had twice the mortality risk of participants who were overweight or obese according to BMI only (HR, 2.24 [CI, 1.52 to 3.32] and 2.42 [CI, 1.30 to 4.53], respectively). Women with normal-weight central obesity also had a higher mortality risk than those with similar BMI but no central obesity (HR, 1.48 [CI, 1.35 to 1.62]) and those who were obese according to BMI only (HR, 1.32 [CI, 1.15 to 1.51]). Expected survival estimates were consistently lower for those with central obesity when age and BMI were controlled for.
Limitations: Body fat distribution was assessed based on anthropometric indicators alone. Information on comorbidities was collected by self-report.
Conclusion: Normal-weight central obesity defined by WHR is associated with higher mortality than BMI-defined obesity, particularly in the absence of central fat distribution.
Primary funding source: National Institutes of Health, American Heart Association, European Regional Development Fund, and Czech Ministry of Health.
Conflict of interest statement
Conflicts of Interest: None declared
Figures
Comment in
-
The Many Paradoxes of Our Modern World: Is There Really an Obesity Paradox or Is It Only a Matter of Adiposity Assessment?Ann Intern Med. 2015 Dec 1;163(11):880-1. doi: 10.7326/M15-2435. Epub 2015 Nov 10. Ann Intern Med. 2015. PMID: 26551376 No abstract available.
-
Fat middle section is less healthy than being obese, say researchers.BMJ. 2015 Nov 9;351:h5975. doi: 10.1136/bmj.h5975. BMJ. 2015. PMID: 26556679 No abstract available.
-
Normal-Weight Central Obesity and Mortality Risk.Ann Intern Med. 2016 Aug 16;165(4):298-9. doi: 10.7326/L16-0073. Ann Intern Med. 2016. PMID: 27538166 No abstract available.
-
Normal-Weight Central Obesity and Mortality Risk.Ann Intern Med. 2016 Aug 16;165(4):298. doi: 10.7326/L16-0074. Ann Intern Med. 2016. PMID: 27538167 No abstract available.
Summary for patients in
-
Summaries for Patients. Normal-Weight Central Obesity and Mortality.Ann Intern Med. 2015 Dec 1;163(11):I-30. doi: 10.7326/P15-9040. Epub 2015 Nov 10. Ann Intern Med. 2015. PMID: 26551531 No abstract available.
References
-
- Welborn TA, Dhaliwal SS. Preferred clinical measures of central obesity for predicting mortality. European journal of clinical nutrition. 2007;61(12):1373–9. - PubMed
Publication types
MeSH terms
Grants and funding
LinkOut - more resources
Full Text Sources
Medical