. 2015 Dec;33(12):1256-1263.
doi: 10.1038/nbt.3408. Epub 2015 Nov 9.

Homology-driven genome editing in hematopoietic stem and progenitor cells using ZFN mRNA and AAV6 donors

Affiliations

Homology-driven genome editing in hematopoietic stem and progenitor cells using ZFN mRNA and AAV6 donors

Jianbin Wang et al. Nat Biotechnol. 2015 Dec.

Abstract

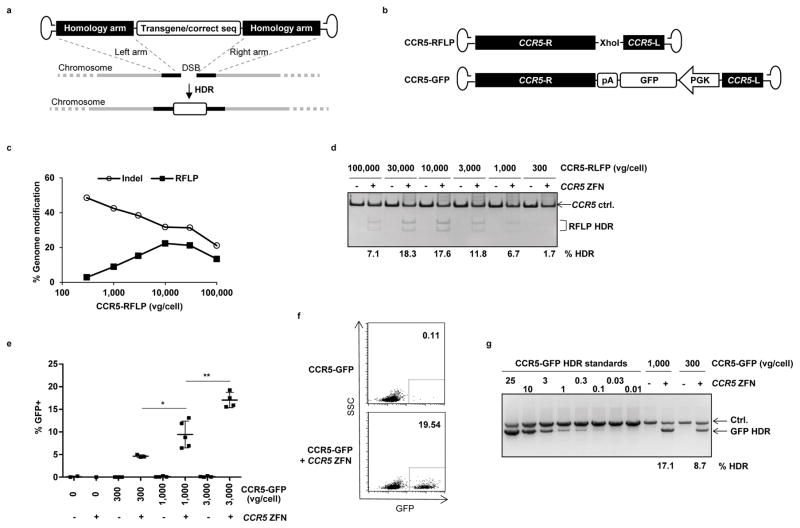
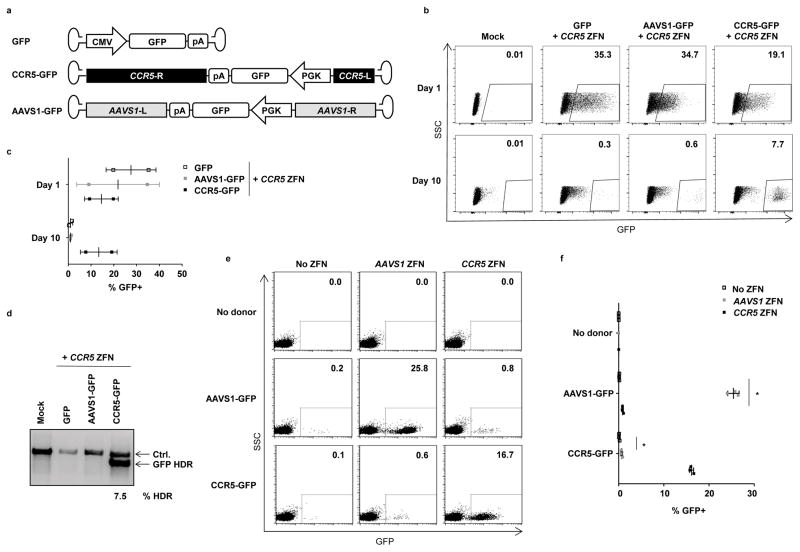
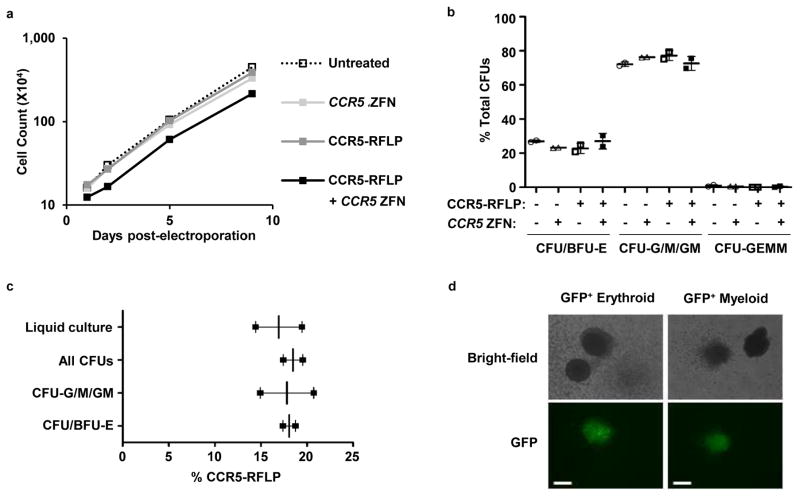
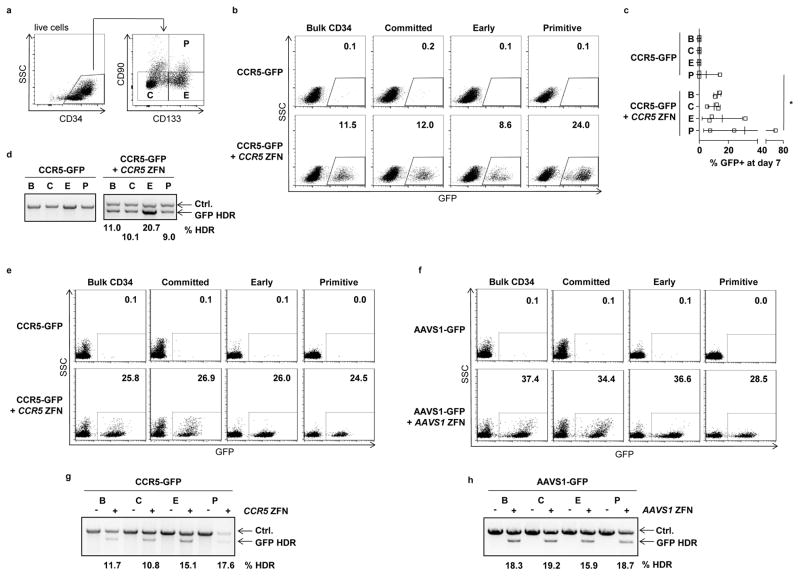
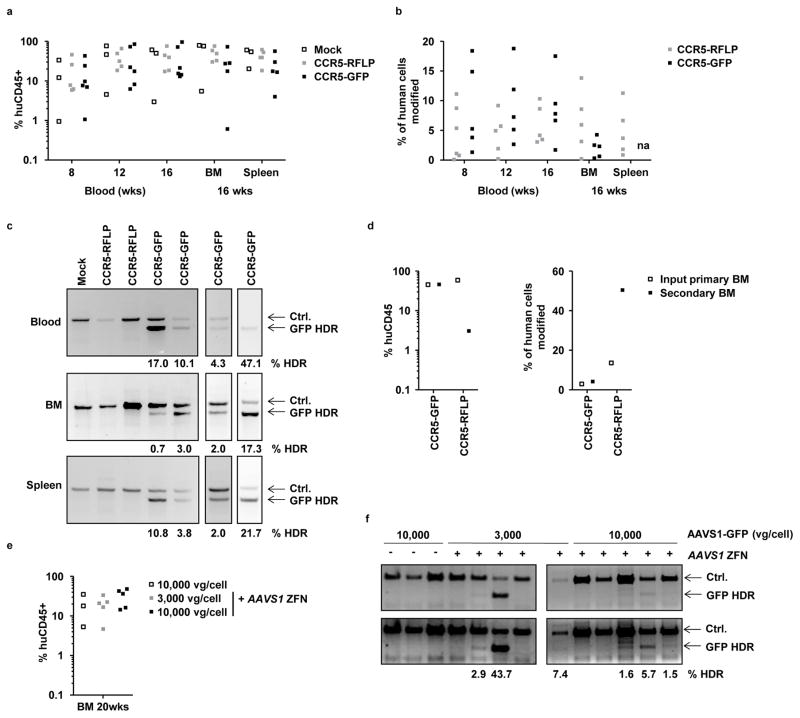
Genome editing with targeted nucleases and DNA donor templates homologous to the break site has proven challenging in human hematopoietic stem and progenitor cells (HSPCs), and particularly in the most primitive, long-term repopulating cell population. Here we report that combining electroporation of zinc finger nuclease (ZFN) mRNA with donor template delivery by adeno-associated virus (AAV) serotype 6 vectors directs efficient genome editing in HSPCs, achieving site-specific insertion of a GFP cassette at the CCR5 and AAVS1 loci in mobilized peripheral blood CD34+ HSPCs at mean frequencies of 17% and 26%, respectively, and in fetal liver HSPCs at 19% and 43%, respectively. Notably, this approach modified the CD34+CD133+CD90+ cell population, a minor component of CD34+ cells that contains long-term repopulating hematopoietic stem cells (HSCs). Genome-edited HSPCs also engrafted in immune-deficient mice long-term, confirming that HSCs are targeted by this approach. Our results provide a strategy for more robust application of genome-editing technologies in HSPCs.


Conflict of interest statement

COMPETING INTERESTS STATEMENT

The following authors are full-time employees of Sangamo BioSciences, Inc.; J.W., J.J.D., S.B.H., P.W.L., D.A.S., R.T.S., P.D.G and M.C.H.

Figures

Figure 1
Figure 1. HSPCs are efficiently transduced by AAV serotype 6
Mobilized blood CD34+ HSPCs (a,b) or fetal liver CD34+ HSPCs (c,d) were transduced with increasing doses of GFP-expressing AAV vectors of the indicated serotypes, and GFP expression was determined at 2 days (fetal liver) or 3–5 days (mobilized blood) post-transduction by flow cytometry. The vector panel for each cell type were from independent manufacturing sources, and the doses used were 1 × 10³, 3 × 10³, 1 × 10⁴, 3 × 10⁴ and 1 × 10⁵ vector genomes (vg)/cell for mobilized blood HSPCs, and 1 × 10², 5 × 10², 1 × 10³, 5 × 10³ and 1 × 10⁴ vg/cell for fetal liver HSPCs. Data from representative experiments at doses of 1 × 10⁴ vg/cell are shown (a,c), together with the mean data +/− SD from 2 (mobilized blood) and 3 (fetal liver) experiments using independent HSPC donor sources (b,d).
Figure 2
Figure 2. Combination of ZFN mRNA and AAV6 vectors promotes high levels of site-specific genome editing at the CCR5 locus in HSPCs
(a) Schematic showing use of AAV vector as a template for homology directed repair (HDR) of a double-strand break (DSB), as induced by target-specific nucleases. (b) Schematic of AAV vector genomes containing CCR5 homology donors. R and L refer to CCR5 genomic sequences, comprising 1431 and 473 bp respectively, and inserted in antisense orientation when compared to the AAV genome. Vector CCR5-RFLP contains an additional Xho1 restriction site and vector CCR5-GFP contains a promoter GFP cassette with a polyadenylation (pA) sequence. (c) Mobilized blood CD34+ HSPCs were transduced with AAV6 vectors carrying the CCR5-RFLP donor at indicated doses for 16 hours, then electroporated with CCR5 ZFN mRNA (120μg/ml). Cells were analyzed 3–5 days post-electroporation by deep sequencing to measure the efficiency of genome modification (% indels and site-specific RFLP insertions). Results from one representative of 3 experiments using 3 different HSPC donors are shown. (d) Dose-dependent insertion of XhoI site at CCR5, confirmed by RFLP analysis. One representative experiment is shown, with % HDR quantitation for any sample greater than background. (e) Mobilized blood HSPCs were treated as described, but using CCR5-GFP donor vectors, with and without CCR5 ZFN mRNA electroporation. Cells were collected 3–6 days post-transduction and analyzed by flow cytometry for % GFP+. Results were combined from 5 experiments using 4 different donors and show mean +/− SD. * p<0.05, ** p<0.01, unpaired t-test. (f) Flow cytometry plots from one representative experiment using 3,000 vg/cell CCR5-GFP donor, at 6 days post-electroporation. (g) Confirmation of targeted integration of GFP expression cassette at the CCR5 locus by semi-quantitative In-Out PCR, for one representative experiment. Ctrl. is a PCR that serves as a genomic DNA loading control. The % HDR-mediated insertion of GFP was estimated following normalization and by comparison to standards, and numbers are shown for any samples greater than background. Uncropped images of all gels in this figure are available in Supplemental Figure 10.
Figure 3
Figure 3. Site-specific genome editing by AAV6 vectors uses homology directed repair
(a) Schematic of AAV vectors used, which all contain a GFP expression cassette. Vector CCR5-GFP additionally contains 1431 and 473 bp sequences with homology to the CCR5 locus, while vector AAVS1-GFP contains 801 and 840bp of sequences with homology to the AAVS1 (PPP1R12C) genomic locus. (b) Fetal liver HSPCs were mock treated (Mock), or transduced with 1,000 vg/cell of the indicated AAV vectors for 24 hours, then electroporated with CCR5 ZFN mRNA. Cells were analyzed for GFP by flow cytometry at day 1 and day 10 post-electroporation. Shown is data from one representative experiment, and (c) mean +/− SD GFP+ for n=2 fetal liver tissues. (d) Evaluation of targeted integration of GFP at the CCR5 locus by semi-quantitative In-Out PCR, for one representative experiment. The Ctrl. PCR serves as a loading control. Quantitation for the single sample above background control is shown. An uncropped image of this gel is available in Supplemental Figure 11. (e) Mobilized blood HSPCs were transduced without or with AAVS1-GFP or CCR5-GFP donors at 10,000 vg/cell for 16 hours, and/or electroporated with AAVS1 or CCR5 ZFN mRNA. Cells were analyzed 8 days post-electroporation by flow cytometry. Shown is data from one representative experiment, and (f) mean ± SD GFP+ expression from n=3 samples, except that the no donor, AAVS1 ZFN and no donor, CCR5 ZFN treatments were n=1. * p < 0.05, one-way ANOVA.
Figure 4
Figure 4. Rates of bulk culture cell growth and genome modification in erythroid and myeloid lineages
(a) Mobilized blood CD34+ HSPCs were transduced with 1,000 vg/cell CCR5-RFLP donor, and/or electroporated 16 hrs later with 40 μg/ml of CCR5 ZFN mRNA. Mock treated HSPCs were cultured as a control. Cells were counted at 1–9 days post-electroporation. Results are shown from one representative experiment from a total of 3 independent experiments using 3 different HSPC donors. (b) Cells were also subjected to colony formation assay at 24 hours post-electroporation, with CFUs evaluated 14 days later. Mean +/− SD from duplicated samples are shown. No significant differences were detected among the 4 treatment conditions (p>0.05, one-way ANOVA). (c) CFUs were also genotyped by deep sequencing to detect rates of insertion of the XhoI site. Between 23 and 88 validated individual colonies were picked for each colony type. Mean +/− SD from 2 combined experiments using different HSPC donors are shown. No significant differences were detected (p>0.05, one-way ANOVA). (d) Mobilized blood HSPCs treated with CCR5-GFP donor and CCR5 ZFN mRNA were used for colony formation assays. Representative GFP+ erythroid and myeloid colonies are shown. The white bars represent 100μm.
Figure 5
Figure 5. Genome editing in different HSPC subsets
(a) Representative flow cytometry plot showing different subsets within fetal liver CD34+ HSPCs, defined as primitive (P) early (E) and committed (C) progenitors. (b) Fetal liver HSPCs were treated with 1,000 vg/cell CCR5-GFP vectors for 24 hours and then electroporated with 40 μg/ml CCR5 ZFN mRNA. One day later the cells were sorted into the indicated populations based on expression of CD133 and CD90. Control cells received only the CCR5-GFP vectors. Cells were cultured for a further 7 days followed by analysis for GFP expression. Representative day 7 flow cytometry plots are shown from both the unsorted and sorted populations in each treatment arm, and (c) Mean +/− SD GFP+ cells at day 7, for n=3 independent CD34+ sources. No significant differences (p>0.05) were observed between subgroups C, E and P in the CCR5-GFP plus CCR5 ZFN treated groups, one-way ANOVA. * p<0.05, unpaired t-test. (d) In-Out PCR showing levels of GFP insertion at the CCR5 locus in the indicated subsets of fetal liver CD34+ cells. The Ctrl. PCR serves as a loading control. Numbers for values above background controls are shown. (e) Mobilized blood CD34+ HSPCs were transduced with 10,000 vg/cell CCR5-GFP, with or without electroporation 16 hours later with 60 μg/ml CCR5 ZFN mRNA. Eight days later, cells were analyzed for GFP expression by flow cytometry in the indicated subsets. The gating strategy used to isolate the P, E and C populations from the bulk CD34+ population is shown in Supplemental Figure 12a. (f) Mobilized blood CD34+ HSPCs were treated as in (e), but using 10,000 vg/cell AAVS1-GFP and 40 μg/ml AAVS1 mRNA. (g) In-Out PCR to detect GFP insertion at the CCR5 locus in the indicated subsets and treatments. Numbers for values above background controls are shown. (h) In-Out PCR to detect GFP insertion at the AAVS1 locus in the indicated subsets and treatments. Numbers for values above background controls are shown. Uncropped images of all gels in this figure are available in Supplemental Figure 12.
Figure 6
Figure 6. Engraftment of NSG mice with gene edited HSPCs
(a) Neonatal NSG mice were engrafted with fetal liver HSPCs, either mock treated, or treated with AAV6 donors (CCR5-GFP or CCR5-RFLP) plus CCR5 ZFN mRNAs, using 2 different donor tissues. Genome editing levels in these input HSPCs were 9.1% and 12% for CCR5-GFP treated cells, by flow cytometry, and 6.7% and 11.2% for CCR5-RFLP treated cells, by deep sequencing. Peripheral blood of the mice was analyzed at weeks 8, 12, and 16 for the % of human CD45+ cells, and bone marrow (BM) and spleen were analyzed at 16 weeks. Shown is the combined data from the two separate cohorts of mice. No significant differences were found in the levels of human cells in the blood or tissues between mock and treated samples (two-way ANOVA). (b) Rates of genome modification in human cells were measured in blood and tissue samples from individual mice by flow cytometry for GFP insertions, or deep sequencing for RFLP insertions; na, not available due to high background autofluorescence of cells. Actual numbers are available in Supplemental Table 3. Cells from mock-treated mice gave only background levels in all assays (not shown). (c) Representative examples of In-Out PCR showing GFP addition at the CCR5 locus in peripheral blood, bone marrow, and spleen from individual mice at 16 weeks post engraftment. Numbers for any samples above the levels of the background controls are shown. (d) Bone marrow was isolated at 16 weeks post-engraftment from 2 mice each from the CCR5-GFP or CCR5-RFLP cohorts and was pooled. The levels of human CD45+ cell engraftment and gene modification (GFP+ by flow cytometry, RFLP insertion by deep sequencing) were measured in the pooled cell populations. Each primary BM pool was used to transplant a separate adult female NSG mouse and, 20 weeks later, bone marrow was isolated from the secondary transplant recipients and analyzed for human CD45+ content and levels of genome modification in the same way. (e) Mobilized blood HSPCs were treated with AAVS1-GFP vectors, with and without AAVS1 ZFN, and used to engraft NSG mice. The frequency of GFP+ cells in the input HSPCs, measured at 5 days post-transfection in culture, were 0.72%, 20.5% and 30.7% respectively, for cells receiving 10,000 vg/cell AAVS1-GFP alone, 3,000 vg/cell AAVS1-GFP plus ZFNs and 10,000 vg/cell AAVS1-GFP plus ZFNs. At 20 weeks, bone marrow was isolated and analyzed for human CD45+ leucocytes. (f) Detection of GFP insertion at the AAVS1 locus in bone marrow samples from individual mice, measured by In-Out PCR. Numbers for any samples above the levels of the background controls are shown. Uncropped images of all gels in this figure are available in Supplemental Figure 13.

Similar articles

Cited by

References

    1. Aiuti A, et al. Correction of ADA-SCID by Stem Cell Gene Therapy Combined with Nonmyeloablative Conditioning. Science. 2002;296:2410–2413. - PubMed
    1. Cartier N, et al. Hematopoietic Stem Cell Gene Therapy with a Lentiviral Vector in X-Linked Adrenoleukodystrophy. Science. 2009;326:818–823. - PubMed
    1. Biffi A, et al. Lentiviral Hematopoietic Stem Cell Gene Therapy Benefits Metachromatic Leukodystrophy. Science. 2013:341. - PubMed
    1. Aiuti A, et al. Lentiviral Hematopoietic Stem Cell Gene Therapy in Patients with Wiskott-Aldrich Syndrome. Science. 2013:341. - PMC - PubMed
    1. Cavazza A, Moiani A, Mavilio F. Mechanisms of Retroviral Integration and Mutagenesis. Human Gene Therapy. 2013;24:119–131. - PubMed