

Trends in Stillbirth by Gestational Age in the United States, 2006-2012
- PMID: 26551188
- PMCID: PMC4669968
- DOI: 10.1097/AOG.0000000000001152
Trends in Stillbirth by Gestational Age in the United States, 2006-2012
Abstract
Objective: To evaluate stillbirth trends by gestational age.
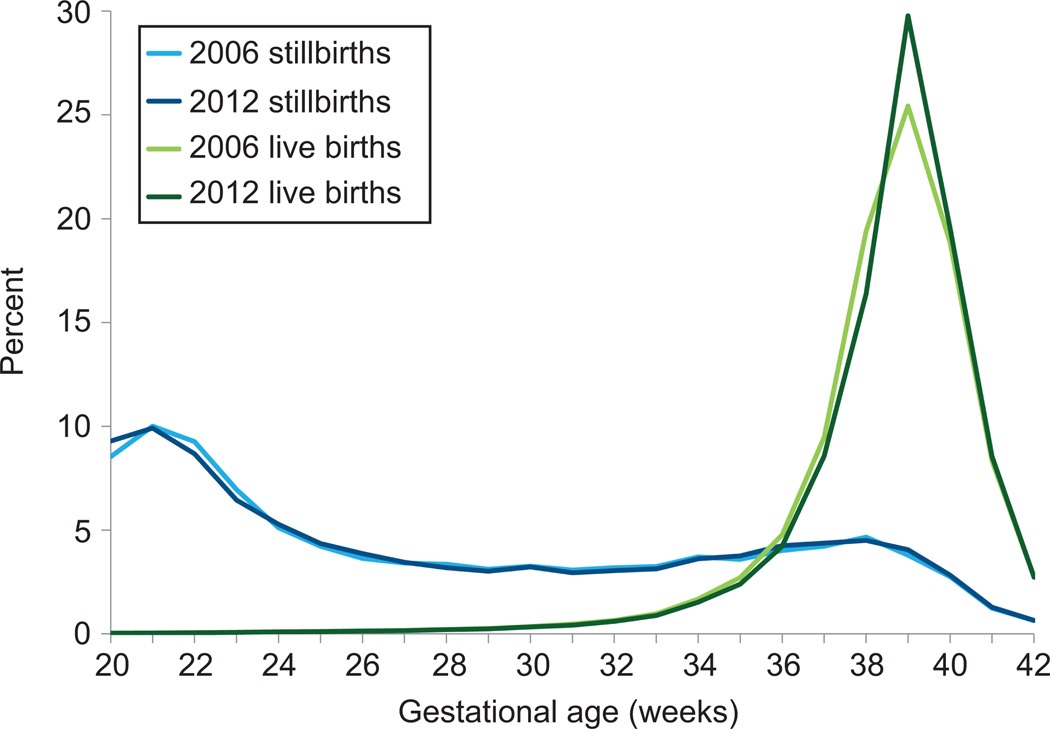
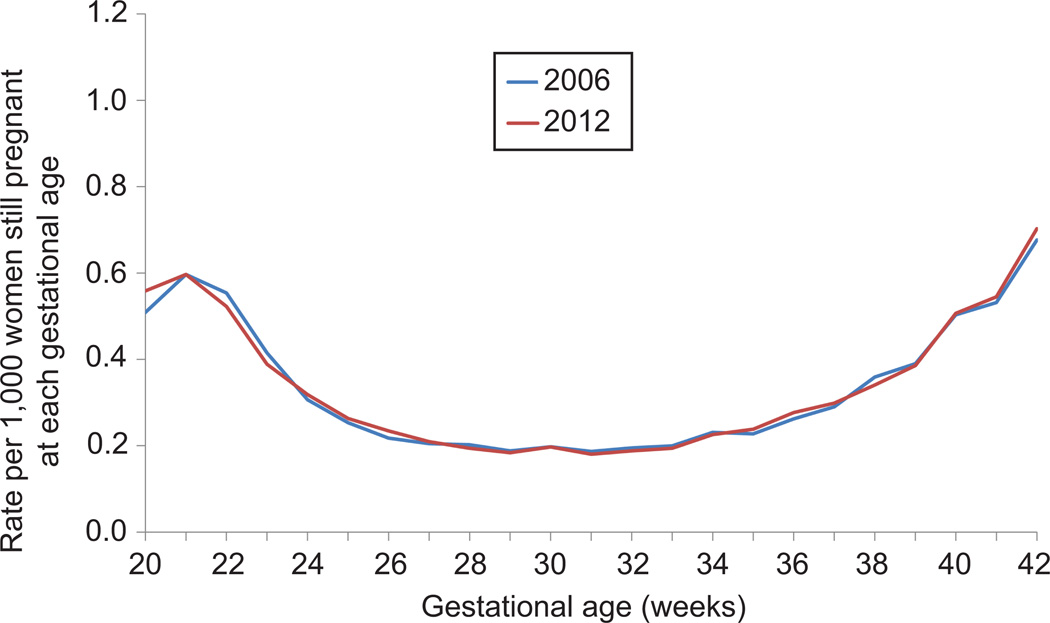
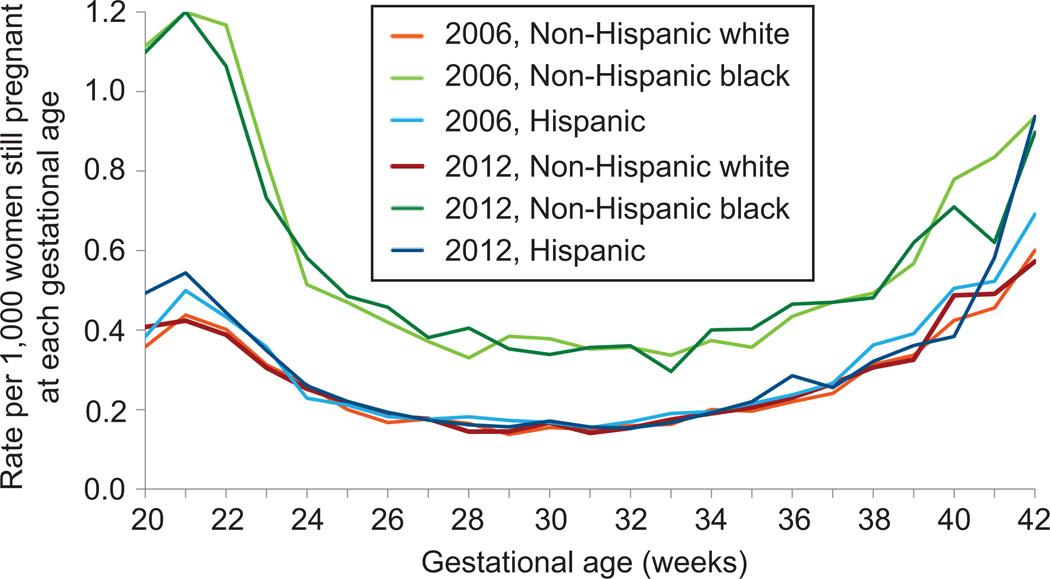
Methods: National Center for Health Statistics' fetal death and live birth data files were used to analyze the 2006 and 2012 cohorts of deliveries and compute gestational age-specific stillbirth rates at 20 weeks of gestation or greater using two methods: traditional (eg, stillbirths at 38 weeks of gestation/live births and stillbirths at 38 weeks of gestation) and prospective (stillbirths at 38 weeks of gestation/number of women still pregnant at 38 weeks of gestation). Changes in rates and in the percent distribution of stillbirths and live births were assessed.
Results: In 2006 and 2012, the stillbirth rate was 6.05 stillbirths per 1,000 deliveries. There was little change in the percent distribution of stillbirths by gestational age from 2006 to 2012. However, the percent distribution of live births by gestational age changed considerably: births at 34-38 weeks of gestation decreased by 10-16%, and births at 39 weeks of gestation increased by 17%. Traditionally computed stillbirth rates were unchanged at most gestational ages, but rose at 24-27, 34-36, 37, and 38 weeks of gestation. However, rates were influenced by decreases in births at those gestational ages; the pattern of stillbirths by gestational age was unchanged. In contrast, there were no differences in prospective stillbirth rates at 21-42 weeks of gestation.
Conclusion: The lack of change in prospective stillbirth rates from 2006 to 2012 suggests that preventing nonmedically indicated deliveries before 39 weeks of gestation did not increase the U.S. stillbirth rate.
Level of evidence: II.
Conflict of interest statement
The authors did not report any potential conflicts of interest.
Figures
Comment in
-
Trends in Stillbirth by Gestational Age in the United States, 2006-2012.Obstet Gynecol. 2016 Apr;127(4):801-802. doi: 10.1097/AOG.0000000000001364. Obstet Gynecol. 2016. PMID: 27008223 No abstract available.
-
A Multi-State Analysis of Early-Term Delivery Trends and the Association With Term Stillbirth Trends in Stillbirth by Gestational Age in the United States, 2006-2012 Stillbirth and the 39-Week Rule: Can We Be Reassured?Obstet Gynecol. 2016 Apr;127(4):802-803. doi: 10.1097/AOG.0000000000001365. Obstet Gynecol. 2016. PMID: 27008225 No abstract available.
-
In Reply.Obstet Gynecol. 2016 Apr;127(4):803-804. doi: 10.1097/AOG.0000000000001367. Obstet Gynecol. 2016. PMID: 27008226 No abstract available.
-
Editor's Note.Obstet Gynecol. 2016 Apr;127(4):805. doi: 10.1097/AOG.0000000000001370. Obstet Gynecol. 2016. PMID: 27008229 No abstract available.
References
-
- Goldenberg RL, Kirby R, Culhane JF. Sillbirth: A review. Journal of Maternal, Fetal and Neonatal Medicine. 2004;16:79–94. - PubMed
-
- Froen JF, Cacciatore J, McClure Em, Kuti O, Jokhio AH, Islam M, Shiffman J. Stillbirths: Why they matter. Lancet. 2011;377:1353–1365. - PubMed
-
- Darmstdt GL, Shiffman J, Lawn JE. Advancing the newborn and stillbirth global agenda: Priorities for the next decade. Arch Dis Child. 2015;100(suppl 1):s13–s18. - PubMed
-
- Gregory EW, MacDorman MF, Martin JA. NCHS data brief no. 169. Hyattsville, MD: National Center for Health Statistics; 2014. Nov, Trends in fetal and perinatal mortality, United States, 2000–2012. - PubMed
-
- Martin JA, Hamilton BE, Osterman MJK, Curtin SC, Mathews TJ. National vital statistics reports. 9. Vol. 62. Hyattsville, MD: National Center for Health Statistics; 2013. Births: Final data for 2012. - PubMed
Publication types
MeSH terms
Grants and funding
LinkOut - more resources
Full Text Sources
Medical
Research Materials
