

Quantitative analysis of intracellular nucleoside triphosphates and other polar metabolites using ion pair reversed-phase liquid chromatography coupled with tandem mass spectrometry
- PMID: 26551209
- PMCID: PMC6130891
- DOI: 10.1016/j.jchromb.2015.10.030
Quantitative analysis of intracellular nucleoside triphosphates and other polar metabolites using ion pair reversed-phase liquid chromatography coupled with tandem mass spectrometry
Abstract
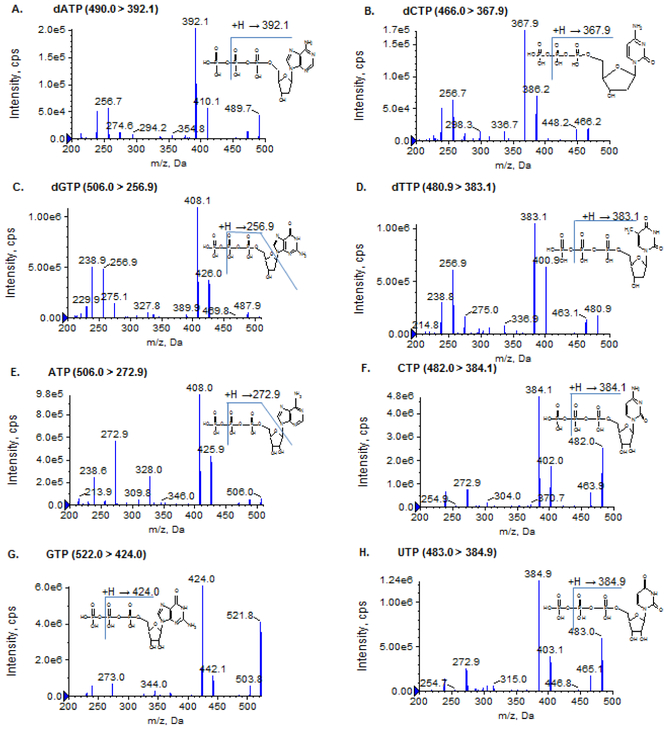
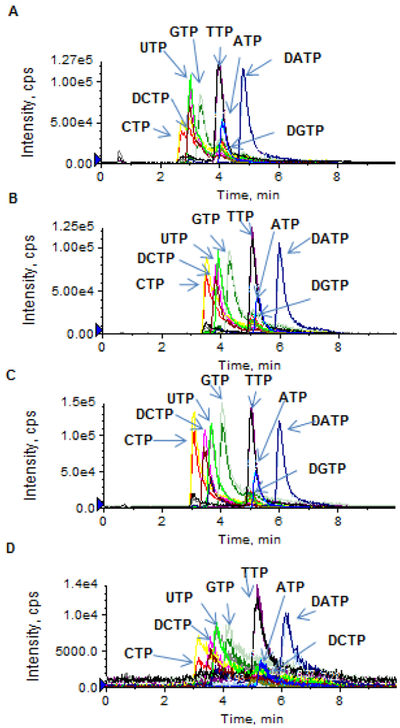
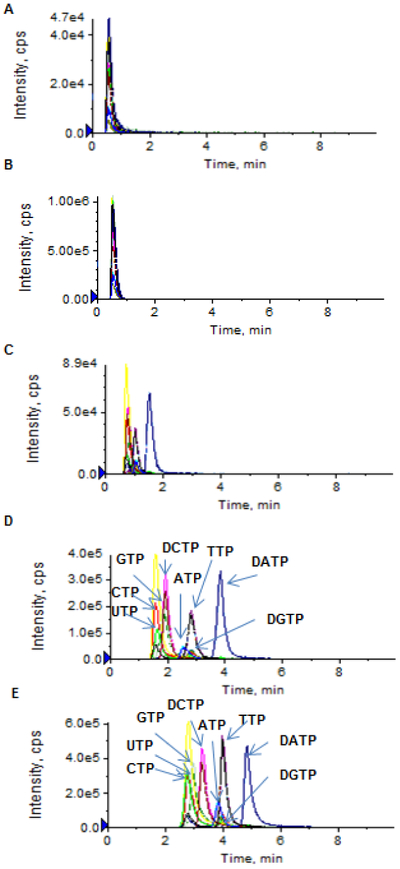
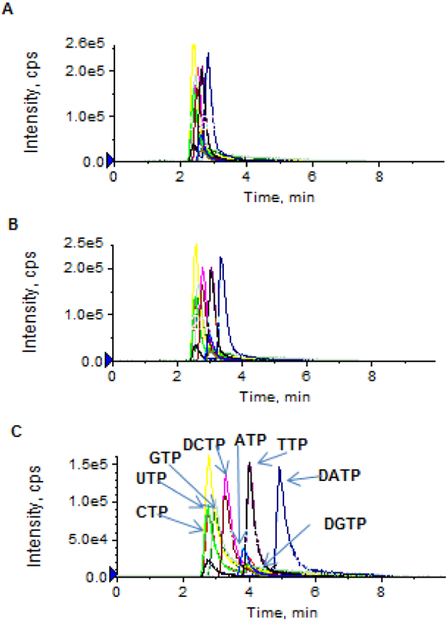
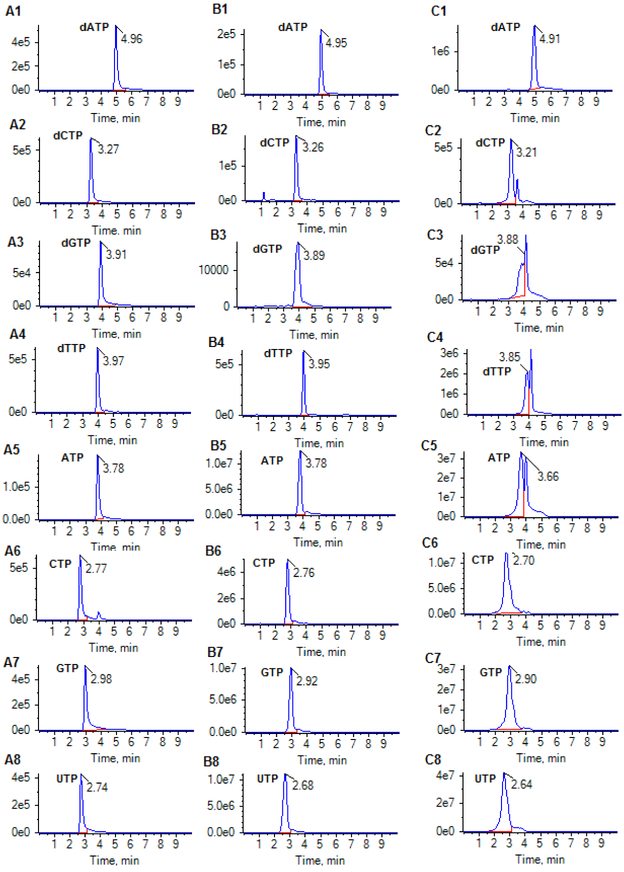
Simultaneous, quantitative determination of intracellular nucleoside triphosphates and other polar metabolites using liquid chromatography with electrospray ionization tandem mass spectrometry (LC-MS/MS) represents a bioanalytic challenge because of charged, highly hydrophilic analytes presented at a large concentration range in a complex matrix. In this study, an ion pair LC-MS/MS method using triethylamine (TEA)-hexafluoroisopropanol (HFIP) ion-pair mobile phase was optimized and validated for simultaneous and unambiguous determination of 8 nucleoside triphosphates (including ATP, CTP, GTP, UTP, dATP, dCTP, dGTP, and dTTP) in cellular samples. Compared to the the less volatile ion-pair reagent, triethylammonium acetate (100mM, pH 7.0), the combination of HFIP (100mM) and TEA (8.6mM) increased the MS signal intensity by about 50-fold, while retaining comparable chromatographic resolution. The isotope-labeled internal standard method was used for the quantitation. Lower limits of quantitation were determined at 0.5nM for CTP, UTP, dATP, dCTP, and dTTP, at 1nM for ATP, and at 5nM for GTP and dGTP. The intra- and inter-day precision and accuracy were within the generally accepted criteria for bioanalytical method validation (<15%). While the present method was validated for the quantitation of intracellular nucleoside triphosphates, it had a broad application potential for quantitative profiling of nucleoside mono- and bi-phosphates as well as other polar, ionic metabolic intermediates (including carbohydrate derivatives, carboxylic acid derivatives, co-acyl A derivatives, fatty acyls, and others) in biological samples.
Keywords: Deoxyribonucleoside triphosphate (dNTP); Ion pair chromatography; LC-MS/MS; Metabolomics; Ribonucleoside triphosphate (NTP).
Copyright © 2015 Elsevier B.V. All rights reserved.
Figures
Similar articles
-
Simultaneous determination of ribonucleoside and deoxyribonucleoside triphosphates in biological samples by hydrophilic interaction liquid chromatography coupled with tandem mass spectrometry.Nucleic Acids Res. 2018 Jun 20;46(11):e66. doi: 10.1093/nar/gky203. Nucleic Acids Res. 2018. PMID: 29554314 Free PMC article.
-
Determination of ribonucleoside triphosphates and deoxyribonucleoside triphosphates in Novikoff hepatoma cells by high-performance liquid chromatography.Anal Biochem. 1987 Jan;160(1):57-64. doi: 10.1016/0003-2697(87)90613-0. Anal Biochem. 1987. PMID: 3565756
-
Liquid chromatography-tandem mass spectrometry assays for intracellular deoxyribonucleotide triphosphate competitors of nucleoside antiretrovirals.J Chromatogr B Analyt Technol Biomed Life Sci. 2003 Jun 15;789(2):273-81. doi: 10.1016/s1570-0232(03)00099-0. J Chromatogr B Analyt Technol Biomed Life Sci. 2003. PMID: 12742119
-
Analysis of Antisense Oligonucleotides and Their Metabolites with the Use of Ion Pair Reversed-Phase Liquid Chromatography Coupled with Mass Spectrometry.Crit Rev Anal Chem. 2019;49(3):256-270. doi: 10.1080/10408347.2018.1517034. Epub 2019 Jan 5. Crit Rev Anal Chem. 2019. PMID: 30612436 Review.
-
Direct and indirect quantification of phosphate metabolites of nucleoside analogs in biological samples.J Pharm Biomed Anal. 2020 Jan 30;178:112902. doi: 10.1016/j.jpba.2019.112902. Epub 2019 Oct 3. J Pharm Biomed Anal. 2020. PMID: 31610397 Free PMC article. Review.
Cited by
-
Targeted Determination of Tissue Energy Status by LC-MS/MS.Anal Chem. 2019 May 7;91(9):5881-5887. doi: 10.1021/acs.analchem.9b00217. Epub 2019 Apr 12. Anal Chem. 2019. PMID: 30938977 Free PMC article.
-
Application of novel plasma separation filter cards for quantification of nucleoside/nucleotide reverse transcriptase inhibitor di/triphosphates in dried blood spots using LC-MS.Bioanalysis. 2023 Jul;15(13):739-756. doi: 10.4155/bio-2023-0057. Epub 2023 Jun 9. Bioanalysis. 2023. PMID: 37293769 Free PMC article.
-
MYH9 binds to dNTPs via deoxyribose moiety and plays an important role in DNA synthesis.Oncotarget. 2022 Mar 14;13:534-550. doi: 10.18632/oncotarget.28219. eCollection 2022. Oncotarget. 2022. PMID: 35309869 Free PMC article.
-
A liquid chromatography-tandem mass spectrometry based method for the quantification of adenosine nucleotides and NAD precursors and products in various biological samples.Front Immunol. 2023 Sep 20;14:1250762. doi: 10.3389/fimmu.2023.1250762. eCollection 2023. Front Immunol. 2023. PMID: 37799723 Free PMC article.
-
n-Butylamine for Improving the Efficiency of Untargeted Mass Spectrometry Analysis of Plasma Metabolite Composition.Int J Mol Sci. 2019 Nov 27;20(23):5957. doi: 10.3390/ijms20235957. Int J Mol Sci. 2019. PMID: 31783473 Free PMC article.
References
-
- Stryer L, Biochemistry (3rd ed.), W. H. Freeman, New York, 1988.
-
- Walton HF, Analytical chemistry, 40 (1968) 51R–62R. - PubMed
-
- Witters E, Van Dongen W, Esmans EL, Van Onckelen HA, Journal of chromatography. B, Biomedical sciences and applications, 694 (1997) 55–63. - PubMed
-
- Cohen S, Megherbi M, Jordheim LP, Lefebvre I, Perigaud C, Dumontet C, Guitton J, Journal of chromatography. B, Analytical technologies in the biomedical and life sciences, 877 (2009) 3831–3840. - PubMed
-
- Claire RL 3rd, Rapid communications in mass spectrometry : RCM, 14 (2000) 1625–1634. - PubMed
Publication types
MeSH terms
Substances
Grants and funding
LinkOut - more resources
Full Text Sources
Other Literature Sources
