. 2015 Nov;56(12):7159-68.
doi: 10.1167/iovs.14-16370.

A Novel, Real-Time, In Vivo Mouse Retinal Imaging System

Affiliations

A Novel, Real-Time, In Vivo Mouse Retinal Imaging System

Mark C Butler et al. Invest Ophthalmol Vis Sci. 2015 Nov.

Abstract

Purpose: To develop an efficient, low-cost instrument for robust real-time imaging of the mouse retina in vivo, and assess system capabilities by evaluating various animal models.

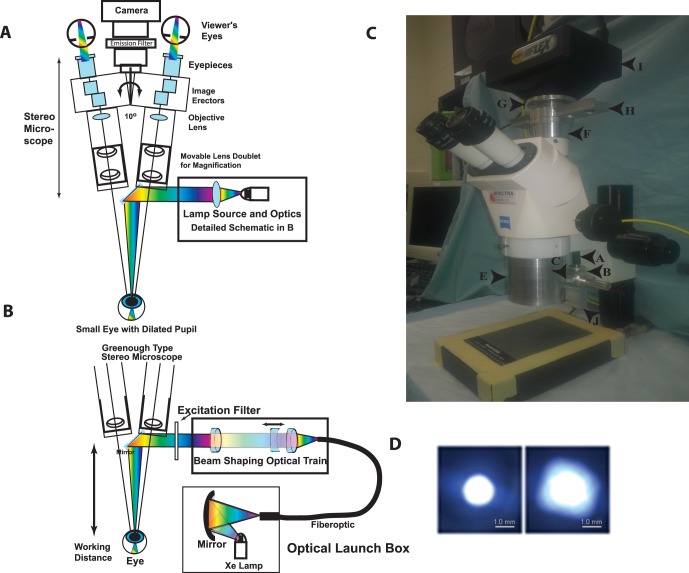
Methods: Following multiple disappointing attempts to visualize the mouse retina during a subretinal injection using commercially available systems, we identified the key limitation to be inadequate illumination due to off axis illumination and poor optical train optimization. Therefore, we designed a paraxial illumination system for Greenough-type stereo dissecting microscope incorporating an optimized optical launch and an efficiently coupled fiber optic delivery system. Excitation and emission filters control spectral bandwidth. A color coupled-charged device (CCD) camera is coupled to the microscope for image capture. Although, field of view (FOV) is constrained by the small pupil aperture, the high optical power of the mouse eye, and the long working distance (needed for surgical manipulations), these limitations can be compensated by eye positioning in order to observe the entire retina.

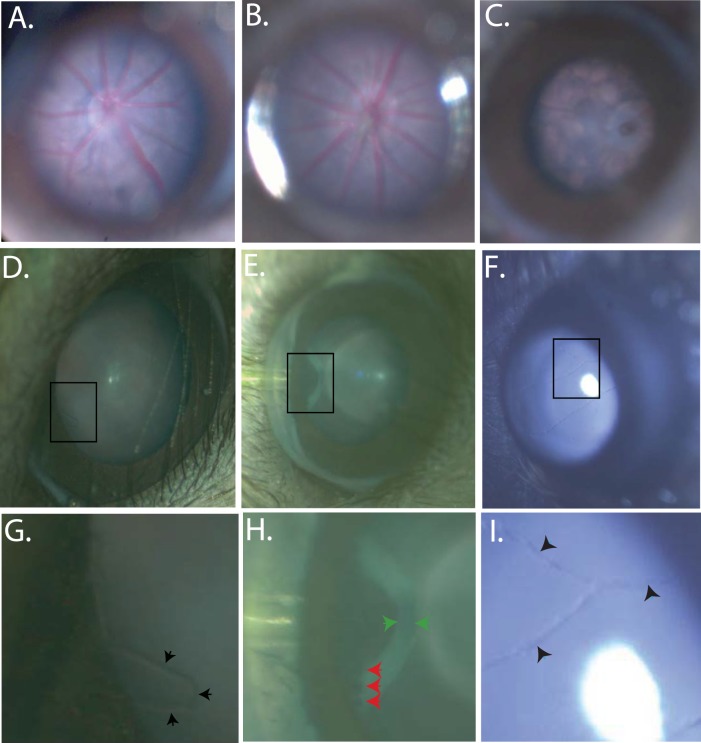
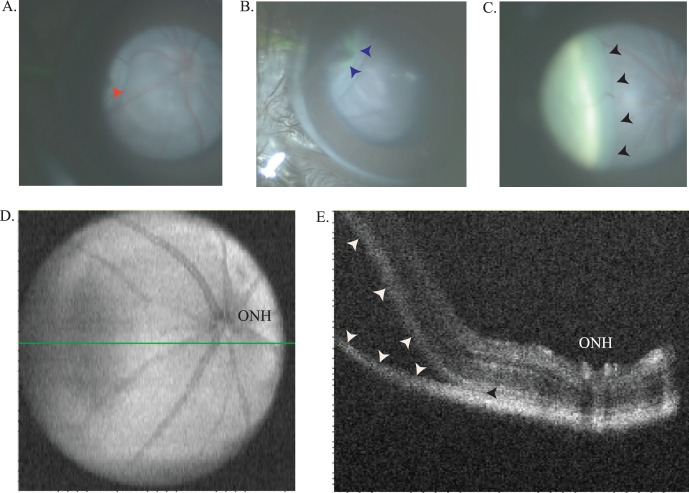
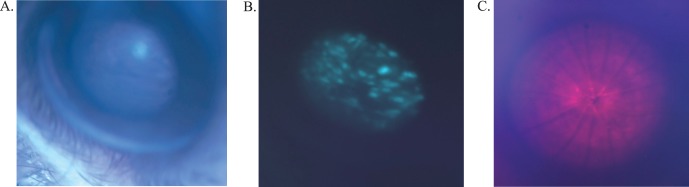
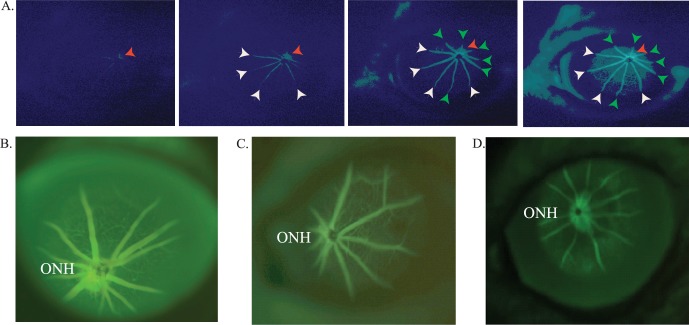
Results: The retinal imaging system delivers an adjustable narrow beam to the dilated pupil with minimal vignetting. The optic nerve, vasculature, and posterior pole are crisply visualized and the entire retina can be observed through eye positioning. Normal and degenerative retinal phenotypes can be followed over time. Subretinal or intraocular injection procedures are followed in real time. Real-time, intravenous fluorescein angiography for the live mouse has been achieved.

Conclusions: A novel device is established for real-time viewing and image capture of the small animal retina during subretinal injections for preclinical gene therapy studies.


Figures

Figure 1
Figure 1
Schematic diagram of the major components of the on-axis retinal imaging platform. (A) An intense small gap continuous xenon source is collected and condensed into a small core diameter fiber optic with approximately matching numerical aperture. The fiber leaves the launch box and is coupled into the Greenough type stereo microscope exploiting the open optical “space” (∼10°) between the two stereo viewing axes. The cone of light emerging from the fiber is collected, shaped, and condensed into a beam focus by an optical train of three achromatic lenses (two fixed positive lenses and one mobile negative lens) with the focal point approximately 7.5 cm from the last optical component in the system. The narrow condensed beam is folded onto the optical axis of the microscope by a tiny front surface mirror or prism that can be used to steer the beam. The beam condenses into the small dilated pupil of the mouse eye in a Maxwellian imaging paradigm. The mouse and eye are positioned to match this point in space for maximal coupling. The eye is visualized with a stereo imaging system and a camera is attached for photodocumentation. Excitation and emission filters are appropriately placed to modulate the input and output beams. (B) Optical schematic of the fiber optic launch box (Welch Allyn, CL-100) and the optical delivery train at the level of the microscope. The short arc xenon source with an NA 0.52 is coupled into a matched high NA fiber with a spherical mirror positioned proximate to the xenon lamp, which is held in a vertical position. The fiberoptic transmits the energy to the stereo microscope, initially orthogonal to the optical axis. An optical rail made from three achromatic lenses collects the energy from the fiber into an approximately collimated beam, shapes the angle of the beam (with the moveable negative achromatic lens), and condenses the beam into the specimen plane. The position of the fiber relative to the first positive achromatic lens shapes the collimation of the beam. The final positive lens focuses the energy onto the specimen plane. An excitation filter modulates the spectral pattern of the beam. A 45° mirror directs the beam onto the optical axis, which resides between the independent stereo imaging axes. (C) Image of the Zeiss Stemi 2000-C microscope modifications for the RIS converting it to the brightfield, far-red, and fluorescence setup. The components include the: fiber optic cable entry point (a), the fiber optic holder (b), the optical elements holder (c), the spot size regulator (d), the microscope body (e), the microscope/camera coupling spacer with emission filter rail (f), the adjustable z-axis camera mounting ring (g), the emission filter rail (four filters) (h), the SPOT Flex camera (i), and the excitation filter rail (j) (the CL-100 light source is not shown). (D) Spot sizes in the mouse pupil plane. Image of the minimum (left) and maximum (right) spot sizes created with a 1.4-mm core fiber input. Images were taken with the beam focused onto a flat optical surface placed at the focal point of the eye input beam. The spot size is controlled by moving the position of the negative beam shaping lens in the optical train. Scale bars: is 1.0 mm.
Figure 2
Figure 2
Bright field in vivo images demonstrating the RIS depth of field and imaging capabilities. Representative fundus images of a C57BL6(N) (6 months) (A), A wild-type human RHO on the mouse RHO knockout background (2HRho//1T/1T; ∼4 months of age) (B); Mouse RHO knockout (129R-; ∼4 months of age). (C) Regions of interest, demonstrating depth of field of the RIS, are boxed in images (DF) are expanded in images (GI) respectively, and show fine anatomical structures which can be identified. Images were enhanced for contrast and brightness to improve the fine details in images (A, B, G, I). Images from an A1 mouse (∼1 month of age) of the anterior chamber, both the cornea and iris are clearly visible, even the smallest of blood vessels are visible protruding from the edge of the iris (black arrow heads) (D, G). The pars plana can be imaged with scleral depression allowing visualization of ciliary body processes (red arrow heads) and the retinal thickness can be visualized highlighted by the (green arrow heads) (E, H). Visualization of the hyaloid vessels (black arrow heads) is shown in (F, I) in a C57BL6(N); ∼2-week old). Imaging of the mouse retina including optic nerve head and vasculature and retinal pigmentation can be clearly visualized (AC). These images demonstrate the depth of view of the internal contents of the mouse eye provided by the RIS and the resolution capabilities of this system. The field of view allows the entire cornea to be imaged, but is more limited when imaging the retina due to the small diameter of the dilated mouse pupil, the effects of the mouse lenticular optics, and the long working distance of the instrument. Imaging of the entire retinal surface can be accomplished by manipulation of the eye or animal.
Figure 3
Figure 3
Subretinal injection imaged in real time. Initial, early, and final images of a subretinal injection in a C1xBL/6 mouse (∼1.5 months of age) using a fluorescein sulfate in 1X PBS (ALTAIRE Pharmaceuticals, Inc.) to visualize the progression of the sub retinal bleb. A 10-second injection (16.6 PSI, using pulled glass capillary needle with a 2-μm tip diameter) captures the entire injection in real time. Including needle tip placement prior to RPE penetration (red arrow) (A), immediately following start of sub retinal injection (blue arrows) (B). Finally, the retinal detachment involving approximately 20% of total retina (black arrows) (C). Optical coherence tomography enface and B-scan images image of the subretinal injection site confirming the injection is located in the subretinal space of the retina. The enface image demonstrates the extent of the subretinal bleb identified by the hypo reflective region of the retina in the nasal region (left side of image) and the B-scan location in (E) is highlighted with a green line (D). A B-scan proximal to the optic nerve head (ONH) and including the leading edge of the injection bleb highlighted by the (white arrows) confirming the injection was localized to the sub retinal space identified by the (black arrowhead) (E).
Figure 4
Figure 4
Bandpass limited imaging modes of the RIS for assessing subretinal injection efficiency and performing far red imaging. Enhanced green fluorescent protein expression assessed in vivo in the retina of a C1xC57BL/6 mouse that received a subretinal injection of AAV-EGFP virus (1.0 μL) at 14 days of age. The bright field (A) and fluorescence images (B) were taken 12 weeks post injection. Bandpass filters were used to excite the EGFP and capture its emission for fluorescence imaging. In vivo imaging of C1xBL6 mouse (∼2 months of age) retina using a far red bandpass filter (692 nm peak, 40 nm bandpass) (C). This allows examination of the posterior pole and vasculature during dark-adapted studies or during subretinal injections in light sensitive animal models (to prevent light damage).
Figure 5
Figure 5
Images from in vivo fluorescein angiography in C1xBL/6 (∼2 months old) in real time. Early, middle, and late images taken after administering a 50 μL bolus of 10 mg/mL fluorescein lite into the tail vein. The perfusion of the ONH (red arrows) is quickly followed by arterial vessels (white arrows), which is then followed by the arteriovenous phase (green arrows) then finally followed by visualization of the small vessels and capillary bed and finally general perfusion (A). Comparative intravenous fluorescein angiography (IVFA) of normal (C57BL6) and a degenerate retina in a homozygous P347S RHO (A1) retinal degeneration mouse. Intravenous fluorescein angiography of the A1 mouse retina shows poor perfusion through attenuated vasculature (due to progression of the retinal degeneration) (compare [C], 5.5 months and [D], 1 year). The brightness and contrast were modified to enhance the image details (A, D).

References

    1. Regus-Leidig H,, Fuchs M,, Lohner M,, et al. In-vivo knockdown of Piccolino disrupts presynaptic ribbon morphology in mouse photoreceptor synapses. Front Cell Neurosci. 2014; 8: 1–13. - PMC - PubMed
    1. Jiang L,, Frederick JM,, Baehr W. RNA interference gene therapy in dominant retinitis pigmentosa and cone-rod dystrophy mouse models caused by GCAP1 mutations. Front Mol Neurosci. 2014; 7: 1–8. - PMC - PubMed
    1. Seo S,, Mullins RF,, Dumitrescu AV,, et al. Subretinal gene therapy of mice with Bardet-Beidl Syndrome Type-1. Invest Ophthalmol Vis Sci. 2013; 54: 6118–6132. - PMC - PubMed
    1. Molday LL,, Djajadi H,, Yan P,, et al. RD3 gene delivery restores guanylate cyclase localization and rescues photoreceptors in the RD3 mouse model of Leber congenital amaurosis 12. Hum Mol Genet. 2014; 22: 3894–3905. - PMC - PubMed
    1. Pang JJ,, Lei L,, Dia X,, et al. AAV-mediated gene therapy in mouse models of recessive retinal degeneration. Curr Mol Med. 2012; 12: 316–330. - PMC - PubMed

Publication types

LinkOut - more resources