. 2015 Dec;18(12):1853-60.
doi: 10.1038/nn.4164. Epub 2015 Nov 9.

Parcellating cortical functional networks in individuals

Affiliations

Parcellating cortical functional networks in individuals

Danhong Wang et al. Nat Neurosci. 2015 Dec.

Abstract

The capacity to identify the unique functional architecture of an individual's brain is a crucial step toward personalized medicine and understanding the neural basis of variation in human cognition and behavior. Here we developed a cortical parcellation approach to accurately map functional organization at the individual level using resting-state functional magnetic resonance imaging (fMRI). A population-based functional atlas and a map of inter-individual variability were employed to guide the iterative search for functional networks in individual subjects. Functional networks mapped by this approach were highly reproducible within subjects and effectively captured the variability across subjects, including individual differences in brain lateralization. The algorithm performed well across different subject populations and data types, including task fMRI data. The approach was then validated by invasive cortical stimulation mapping in surgical patients, suggesting potential for use in clinical applications.


Conflict of interest statement

COMPETING FINANCIAL INTERESTS

H.L., D.W., R.L.B., and M.D.F are listed as inventors on submitted patents on mapping functional brain organization using fMRI. M.D.F. is listed as inventor on submitted or issued patents on guiding noninvasive brain stimulation with fMRI.

Figures

Figure 1
Figure 1
Parcellating the functional networks in an individual subject’s brain using an iterative adjusting approach. The technique includes the following steps: 1) A population-based functional brain atlas was registered onto the individual subject’s cortical surface using FreeSurfer. The individual subject’s BOLD signal time courses were then averaged across the vertices that fall within each network. These atlas-based network time courses were used as the “reference signals” for the subsequent optimization procedure. 2) The individual subject’s BOLD signal at each vertex was then correlated to the 18 “reference signals”. Each vertex was reassigned to one of the 18 networks according to its maximal correlation to the “reference signals”. A confidence value was also computed as the ratio between the largest and the second largest correlation values. After each vertex was reassigned, the BOLD signals of the high confidence vertices (e.g., >1.1) in each network were then averaged and termed the “core signal”. 3) For each network, the “core signal” derived from Step 2 and the original “reference signals ” derived from Step 1 were averaged in a weighted manner. Specifically, the “core signal” was multiplied by the weighting parameters derived from inter-subject variability and SNR, as well as the number of iterations. The averaged signal was used as the new “reference signal” for the next iteration. Using these new “reference signals”, the brain vertices were further reassigned to one of the 18 networks. 4) Steps 2 & 3 were repeated until the algorithm reached a pre-defined stopping criterion.
Figure 2
Figure 2
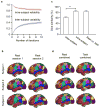
Iterative brain parcellation is highly reproducible within subjects and captures differences across subjects. Twenty-three healthy subjects underwent five resting-state scanning sessions within six months. The functional organization of the individual subject’s brain was parcellated into 18 networks using the data of each scanning session. The parcellation networks of three subjects that showed the highest reproducibility across sessions are displayed so that inter-subject variability can be appreciated. The functional maps of different subjects differed substantially, especially in the higher-order association areas (see also Supplementary Fig. 2 for maps of three subjects that showed the highest, median, and lowest reproducibility. Maps of all 23 subjects can be downloaded at: http://nmr.mgh.harvard.edu/bid/download.html).
Figure 3
Figure 3
Quantitative analyses of intra-subject reliability and inter-subject variability based on the HCP subjects. (a) One hundred subjects from the Human Connectome Project (the “Unrelated 100”) were employed for validation purposes. Intra-subject reliability and inter-subject variability of the parcellation maps after each iteration are plotted. Standard deviations are represented as shaded regions around the curves. As the iteration progressed, inter-subject variability increased, while intra-subject reliability decreased (see also Supplementary Fig. 3 for spatial distributions of reliability and variability after each iteration). (b) The networks of three exemplary subjects are displayed. Maps of all 100 subjects can be downloaded at: http://nmr.mgh.harvard.edu/bid/download.html. (c) Parcellation based on the resting-state fMRI demonstrated high intra-subject reliability and high inter-subject variability. Comparing two rs-fMRI sessions of the same subject, on average 82.4% ± 3.2% of the vertices were assigned to the same networks. Between any two individuals, on average only 60.5% ± 2.8% of the brain vertices were assigned to the same networks. Error bars are mean ± SD. The intra-subject consistency of network membership was significantly higher than the inter-subject consistency (unpaired two-tailed t-test, p<0.001). The iterative parcellation technique was also applied to the concatenated task data of the 100 HCP subjects. Parcellation results based on task data and resting-state data demonstrated an overlap of 81.7% ± 4.0%, suggesting that whole-brain network parcellation could also be obtained from an individual subject’s task data. (d) Networks derived from the concatenated task data are shown for three exemplary subjects.
Figure 4
Figure 4
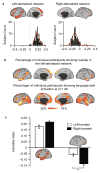
Brain lateralization is reflected in the network parcellation. (a) A laterality index was computed for each parcellation network. Histograms of LIs were plotted for the two networks that demonstrated strongest lateralization in the 100 HCP subjects, where positive values indicate left lateralization. The strongest left-lateralized network was located in the traditional language area and the strongest right-lateralized network was located in the traditional ventral attention area. (b) The strongest left-lateralized parcellation network also overlapped with the regions showing activation during a language task. The maps display the percentage of subjects showing overlap in the left-lateralized network and the percentage of subjects showing language activation (Z>1.96, corresponding to uncorrected, two-tailed p<0.05). Activation maps were estimated using the general linear model. At the group level, 71.2% of the vertices in the left-lateralized network fell within the regions activated by the language task. (c) Handedness has an effect on functional network lateralization. The lateralization indices of the language-related and ventral attention-related networks were computed in 52 left handed and 52 matched right handed subjects. Compared to left handed subjects, right handed subjects showed a trend for stronger lateralization in the language-related network (p=0.057, unpaired two-tailed t-test) and significantly stronger lateralization in the ventral attention-related network (p = 0.003, unpaired two-tailed t-test). Error bars are mean ± SEM.
Figure 5
Figure 5
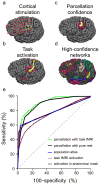
Sensorimotor networks identified by individual brain parcellation showed good correspondence with functional regions localized by invasive cortical stimulation. (a) The hand and tongue sensorimotor regions of eight surgical candidates were mapped using multiple approaches for comparison. Sensorimotor regions identified by ECS were used as the gold standard. The red dots on the ECS maps indicate negative electrodes, while the yellow dots indicate positive electrodes. (b) Sensory and motor areas identified by traditional task activation showed low consistency with the ECS maps. (c) The hand sensorimotor regions identified by iterative parcellation based on the concatenated task fMRI data were consistent with the ECS maps. The map shows the vertices with high confidence values (>1.2). (d) Individual brain parcellation may serve as a prescreening method for ECS. The map shows the network membership of vertices with high confidence values (>1.1). Iterative parcellation can provide a rough estimate of the regions of interest for cortical stimulation, potentially shortening the stimulation procedure. (e) The sensitivity and specificity of the hand and tongue sensorimotor maps in 8 surgical patients were statistically measured across a wide range of thresholds for five different mapping approaches. The results are displayed in ROC curves, including the iterative parcellation technique using task fMRI of eight subjects (green), the iterative parcellation technique using pure resting-state fMRI of six subjects (black), directly projecting the population-based atlas to each individual subject (blue), traditional task-activation mapping alone (purple) and task activation masked with anatomical labels generated by FreeSurfer (red).

References

    1. Brodmann K. In: Localisation in the cerebral cortex. Garey LJ, translator. New York: Springer; 1909/2006.
    1. Vogt C, Vogt O. Allgemeinere Ergebnisse unserer Hirnforschung. J Psychol Neurol. 1919;25:292–398.
    1. Toga AW, Thompson PM, Mori S, Amunts K, Zilles K. Towards multimodal atlases of the human brain. Nat Rev Neurosci. 2006;7:952–966. - PMC - PubMed
    1. Zilles K, Amunts K. Centenary of Brodmann’s map—conception and fate. Nat Rev Neurosci. 2010;11:139–145. - PubMed
    1. Amunts K, et al. Broca’s region revisited: cytoarchitecture and intersubject variability. J Comp Neurol. 1999;412:319–341. - PubMed

Publication types