Comparative Study
. 2015 Dec;47(12):1426-34.
doi: 10.1038/ng.3444. Epub 2015 Nov 9.

Genomic profiling of Sézary syndrome identifies alterations of key T cell signaling and differentiation genes

Affiliations
Comparative Study

Genomic profiling of Sézary syndrome identifies alterations of key T cell signaling and differentiation genes

Linghua Wang et al. Nat Genet. 2015 Dec.

Abstract

Sézary syndrome is a rare leukemic form of cutaneous T cell lymphoma characterized by generalized redness, scaling, itching and increased numbers of circulating atypical T lymphocytes. It is rarely curable, with poor prognosis. Here we present a multiplatform genomic analysis of 37 patients with Sézary syndrome that implicates dysregulation of cell cycle checkpoint and T cell signaling. Frequent somatic alterations were identified in TP53, CARD11, CCR4, PLCG1, CDKN2A, ARID1A, RPS6KA1 and ZEB1. Activating CCR4 and CARD11 mutations were detected in nearly one-third of patients. ZEB1, encoding a transcription repressor essential for T cell differentiation, was deleted in over one-half of patients. IL32 and IL2RG were overexpressed in nearly all cases. Our results demonstrate profound disruption of key signaling pathways in Sézary syndrome and suggest potential targets for new therapies.


Figures
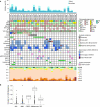
Fig. 1
Fig. 1. Somatic genomic alterations identified in SS patients
a) The upper panel shows somatic mutation rates estimated by WES. The middle panel shows somatic mutations by patient (columns) and by gene (rows) including point mutations, somatic copy number alterations, and recurrent fusion transcripts. The top rows are patient IDs, followed by clinical and histopathological data. Race: W, White; AA, African American; H, Hispanic; AI, American Indian. SS origin: Pre-MF, pre-existing MF. LCT, large cell transformation. LOH, loss of heterozygosity. The number of months lived after disease diagnosis to last clinical visit or death was indicated together with the vital status. Annotation of RNA-seq expression was added for all missense and splicing mutations. A star indicates that the mutant allele was observed in the corresponding transcripts from RNA-seq data. Only genes that met one of the following criteria were included in the table: significantly mutated genes (MutSigCV, false discovery rate <0.1; BCMsig, total points ≥9); significant focal copy number alterations; with in-frame fusions in ≥2 patients; cancer related or biologically important (overlap with Cancer Gene Census or MSigDB database, see URLs) and with 2 or more nonsense, frame-shift, or expressed missense mutations, and were replicated in the extension cohort. Bottom panel: the mutational spectral. DNM, dinucleotide mutations; Indel, small insertions and deletions. §RNA-seq was not performed; ¶SNP array was not performed, due to lack of materials. b) Prevalence of UVB signatures in SS and other cancer types.
Fig. 2
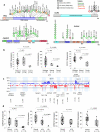
Fig. 2. Significant somatic mutation and copy number alterations
a) Schematic representation of somatic mutations identified in TP53, CARD11, CCR4, and PLCG1. The red arrowhead indicates the breakpoint for CARD11 fusion; the coiled-coil domains of N-terminal portion are maintained in the fusion. b) Correlation analysis of somatic mutation and gene expression. Those five patients without RNA-seq data were excluded from the analysis. c) Aggregation of somatic copy number alterations. For all frequently occurred focal copy number alterations, the cytogenetic positions were indicated and the names of involved genes that have potential pathogenic significance were displayed; bolded type face were for focal events. For chromosomal arm-level alterations, only the positions and names of well-known cancer-related genes were displayed. d) Correlation analysis of somatic copy number alteration and gene expression. The copy number status was inferred by Nexus (BioDiscovery, Inc.) analysis of the SNP array data. The gene expression levels were normalized FPKM values calculated by the Cufflinks algorithm using RNA-seq data. Those six patients without RNA-seq or SNP array data were excluded from the analysis. For ARID1A correlation analysis, two additional patients with inactivating ARID1A mutations were also excluded. P-values were calculated by one-way ANOVA and student t-test. LOH, loss of heterozygosity; HD, homozygous deletion.
Fig. 3
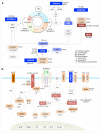
Fig. 3. The dysregulated signaling pathways
a) The cell cycle checkpoint machinery. b) T-cell receptor (TCR) signaling pathway. The genes with inactivating mutations or copy number losses were colored in blue; the genes with activating mutations, copy number gains or significantly upregulated genes in comparison with control T cells were colored in red; genes with all other genetic alterations were colored in orange; genes without detectable alterations but are important components of the pathway are also included and shown in white rectangles; for each gene with somatic alterations, the percentage of cases altered was indicated; for significantly upregulated genes, the average fold changes are also shown.
Fig. 4
Fig. 4. Increased IL32 gene and protein expression
a) Expression profiles of all the interleukins in SS patients. The gene expression data were generated from RNA-seq. The five control samples were obtained from sorted CD4+ T cells from healthy donors. (b) The cellular IL32 protein expression in 9 CTCL cell lines. (c) IL32 protein expression in the peripheral blood mononuclear cells (PBMCs) from 3 healthy donors (HD-1, 2, 3) and 7 SS patients. The protein expression was assessed by western blot with anti-human IL32 monoclonal antibody. The overall IL32 gene expression levels estimated from RNA-seq data (on purified SS cells) and the number of circulating SS cells in patients’ PBMCs were shown and color scaled.
Fig. 5
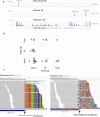
Fig. 5. Characterization of TCR clonality using RNA-seq
(a) Representative RNA-seq read coverage data showing the monoclonal, biclonal and polyclonal TCR-Vβ. The data ranges are shown on the left and the sample IDs are shown on the right. Clonally expressed TCR genes were indicated. b) The relationship of TCR-Vβ and Vα. Bi, biclonal; Mono, monoclonal; poly, polyclonal. Each circle represents a patient, which is placed in a box to indicate the state of its Vα and Vβ expression. c) Representative images showing partially aligned sequencing reads at the breakpoints of a TCR V-region rearrangement for a patient with monoclonal Vα and polyclonal Vβ. The matched sequencing bases are in gray and the non-aligned bases shown color-coded (A, T, C, G; green, red, blue, brown, respectively) indicating the recombination break point where the V region adjoins its partner J region (Vα) or D region (Vβ). At the Vα exon all non-aligned reads exhibit the same sequence (note vertical striping of colors) indicating clonality in expression; at Vβ all non-aligned reads are different (note checkered pattern of colors) indicating polyclonal rearrangements of this V region.
Fig. 6
Fig. 6. Survival and correlation analysis
For survival analysis (a), the Kaplan-Meier survival plots were shown and the p-values were calculated by Log-Rank test. For frequency comparison (b), the p values were calculated by Fisher's exact test. For comparison of UVB signature and IL32 expression, the p-values were calculated by t-test. Those four Caucasian patients without RNA-seq data were excluded from analysis.

References

    1. Campbell JJ, Clark RA, Watanabe R, Kupper TS. Sezary syndrome and mycosis fungoides arise from distinct T-cell subsets: a biologic rationale for their distinct clinical behaviors. Blood. 2010;116:767–71. - PMC - PubMed
    1. Girardi M, Heald PW, Wilson LD. The pathogenesis of mycosis fungoides. N Engl J Med. 2004;350:1978–88. - PubMed
    1. Kim YH, Liu HL, Mraz-Gernhard S, Varghese A, Hoppe RT. Long-term outcome of 525 patients with mycosis fungoides and Sezary syndrome: clinical prognostic factors and risk for disease progression. Arch Dermatol. 2003;139:857–66. - PubMed
    1. Olsen E, et al. Revisions to the staging and classification of mycosis fungoides and Sezary syndrome: a proposal of the International Society for Cutaneous Lymphomas (ISCL) and the cutaneous lymphoma task force of the European Organization of Research and Treatment of Cancer (EORTC). Blood. 2007;110:1713–22. - PubMed
    1. Jawed SI, Myskowski PL, Horwitz S, Moskowitz A, Querfeld C. Primary cutaneous T-cell lymphoma (mycosis fungoides and Sézary syndrome): part I. Diagnosis: clinical and histopathologic features and new molecular and biologic markers. Journal of the American Academy of Dermatology. 2014;70:205, e1–16. quiz 221-222. - PubMed

Publication types

MeSH terms

Associated data