. 2016 Jan;17(1):104-12.
doi: 10.1038/ni.3314. Epub 2015 Nov 9.

The cytotoxic T cell proteome and its shaping by the kinase mTOR

Affiliations

The cytotoxic T cell proteome and its shaping by the kinase mTOR

Jens L Hukelmann et al. Nat Immunol. 2016 Jan.

Abstract

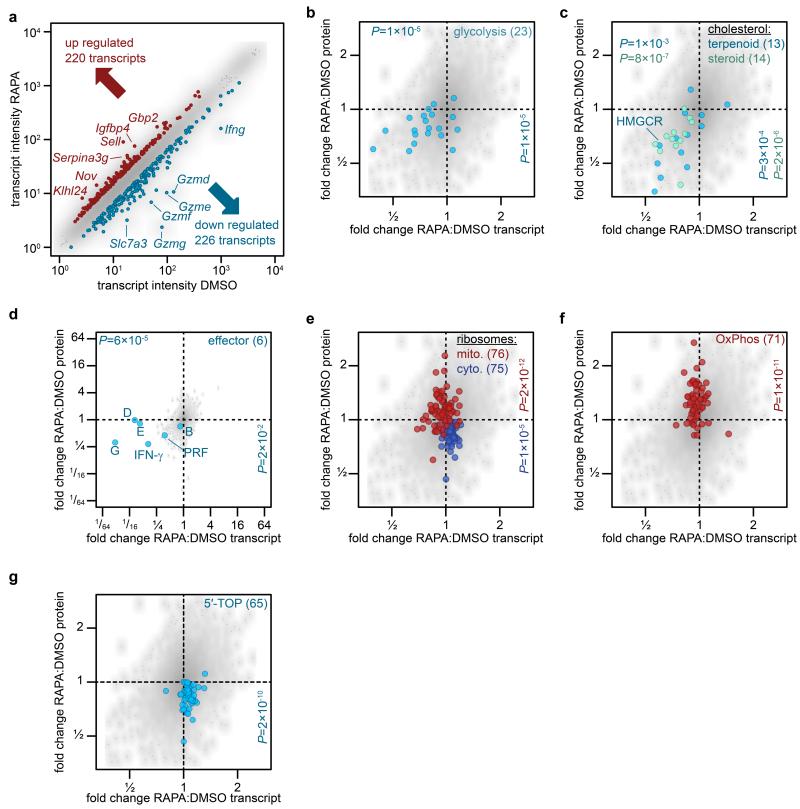
We used high-resolution mass spectrometry to map the cytotoxic T lymphocyte (CTL) proteome and the effect of the metabolic checkpoint kinase mTORC1 on CTLs. The CTL proteome was dominated by metabolic regulators and granzymes, and mTORC1 selectively repressed and promoted expression of a subset of CTL proteins (~10%). These included key CTL effector molecules, signaling proteins and a subset of metabolic enzymes. Proteomic data highlighted the potential for negative control of the production of phosphatidylinositol (3,4,5)-trisphosphate (PtdIns(3,4,5)P3) by mTORC1 in CTLs. mTORC1 repressed PtdIns(3,4,5)P3 production and determined the requirement for mTORC2 in activation of the kinase Akt. Our unbiased proteomic analysis thus provides comprehensive understanding of CTL identity and the control of CTL function by mTORC1.


Figures

Figure 1
Figure 1. The cytotoxic T cell proteome
(a) Scatter plots of estimated protein copy numbers using the proteomic ruler approach show high reproducibility of protein intensities and ~94% of identified proteins are detected in all three biological replicates. R2 = coefficient of determination. (b) CTL proteins ranked by abundance as estimated by mean iBAQ intensities and plotted against the cumulative protein abundance. The proteomic ruler protocol was used to quantify mean protein copy number and relative abundance based on iBAQ intensities. The 12 most abundant proteins contribute 25% of the CTL proteome; 64 and 249 proteins contribute to 50% and 75% of the CTL proteome. (c) Histogram of log-transformed mean protein copy number quantified using the proteome ruler. Protein expression levels span nearly seven orders of magnitude. Intensity quartiles are depicted in different colors and enriched KEGG pathways (p<0.01, Bonferroni corrected) are displayed above each quartile. The contribution of the most abundant KEGG pathways to the total CTL proteome in terms of molecules or mass is shown in the table. Mean iBAQ values and copy numbers are based on three biological replicates.
Figure 2
Figure 2. Comparison of the abundance of key CTL proteins
Histograms of log-transformed mean estimated copy numbers of CTL proteins using the proteomic ruler methodology. Quantification accuracy based on number of detected peptides, fraction of unique/Razor peptides to total peptides and theoretically observable peptides. (a) Key nutrient transporters, (b) CTL effector molecules, (c) transcription factors, (d) tyrosine kinases and phosphatases involved in TCR and IL-2 receptor signaling, (e) IL-2 receptor subunits and associated tyrosine kinases. Protein = protein name, copies = Mean estimated copy number/cell, CV = coefficient of variation, QA = quantification accuracy. Mean copy numbers and CV are based on three biological replicates. Copy numbers for all CTL proteins can be assessed by using the Encyclopedia of Proteome dynamics (http://www.peptracker.com/epd)
Figure 3
Figure 3. Comparison of the CTL transcriptome and proteome
(a) Scatter plots show mean Affymetrix microarray transcript intensities plotted against the corresponding estimated mean copy numbers for CTL proteins. The data show a moderate overall correlation of protein abundance with transcript abundance R2 = coefficient of determination of 0.43. (b, c) Discordance of mean transcript and protein levels for (b) transcription factors T-bet and Eomes and (c) IL-2 receptor subunit α vs β and γc. (d, e) Tight control and correlation of transcript and protein levels for subunits of ribosome protein complexes (d) or granzyme isoforms (e). (b) P-values determined by two-sided, equal variance t-test on transcript intensities or protein copy numbers, respectively. All data are based on three biological replicates.
Figure 4
Figure 4. The mTORC1 regulated CTL proteome
(a) Immunoblot analysis of mTORC1/2 substrates in P14 TCR transgenic CTLs cultured with IL-2/IL-12 ± 48 h treatment with either rapamycin or KU-0063794. (b) Protein synthesis was examined by monitoring 3H-Met incorporation into nascent proteins in CTLs cultured in IL-2/IL-12 and treated with rapamycin for the indicated time. (c) Cellular protein content of CTLs ± 48 h rapamycin. (d, e,) Volcano plots showing fold changes in proteins vs. log-transformed P-values from mass spectrometry analysis of CTLs ± 48 h rapamycin. (d) Total proteins. Known rapamycin sensitive proteins perforin and L-selectin are highlighted. (e) CTL effector molecules. (f) IFN-γ secretion by CTLs ± 48 h rapamycin measured by ELISA. (h) Immunoblot analysis of T-bet in CTLs ± 48 h rapamycin. (h, i) Validation of up-regulated proteins: (h) ELISA of shed CD62L in cell supernatants prepared from CTLs ± 48 h rapamycin. (i) Immunoblot analysis of IRS2 in CTLs ± 48 h rapamycin. (a, g, i): representive immunoblots of at least three biological replicates. (b, c, f, h): individual data points and means are shown. P-values shown determined by (b): one-way ANOVA (Holm-Sidak) vs. DMSO as control on non-normalized data; (c, f, h): two-tailed Student’s t-test. Data based on three (b, f, h) or four (c) biological replicates. *P<0.05, **P<0.01, ***P<0.001. (d, e,): Each data point represents mean fold change of three biological replicates vs. P-value determined by two-tailed, unequal variance t-test; measurements based on three biological replicates.
Figure 5
Figure 5. mTORC1 regulation of cellular pathways
(a, b, c) Volcano plots of down regulated KEGG pathways in rapamycin treated CTLs: (a) glycolysis and glucose transporters, (b) terpenoid backbone and steroid biosynthesis with rate limiting enzyme HMGCR highlighted, (c) cytoplasmic subunits of ribosomes and aminoacyl-tRNA biosynthesis. (d, e) Volcano plots of up-regulated KEGG pathways in rapamycin treated CTLs: (d) oxidative phosphorylation, (e) mitochondrial subunits of ribosomes and aminoacyl-tRNA biosynthesis. Each data point represents mean fold change of three biological replicates vs. P-value determined by two-tailed, unequal variance t-test; measurements based on three biological replicates.
Figure 6
Figure 6. Comparison of the mTORC1 controlled transcriptome and proteome in CTL
(a) Plot showing mean microarray probe intensities from RNA isolated from CTLs cultured in IL-2/IL-12 ± 48 h rapamycin. mTORC1 inhibition increased levels of 220 transcripts and decreased 226 transcripts (total of 8198 expressed transcripts). Examples of transcriptional (b-d) and non-transcriptional (e-g) regulation of protein expression by mTORC1. (b) Glycolytic enzymes and glucose transporters (c) terpenoid backbone and steroid biosynthesis pathways (SREBP1/2 targets), (d) cytolytic effector molecules (single letters indicate granzyme isoforms, PRF = Perforin; note different scaling of axes), (e) cytoplasmic and mitochondrial ribosomal subunits, (f) oxidative phosphorylation (OxPhos), (g) proteins encoded by mRNA containing 5′-TOP containing mRNA (as reported). (b-g) P-values determined by Mann-Whitney U test vs. total transcriptomic (n=5516) or proteomic (n=6641) dataset, respectively. Horizontal values on the top indicate P-values determined from transcriptomic analysis, vertical values at the right for proteomic analysis. Number of transcript-protein pairs for each pathway given in brackets. All data points are based on three biological replicates and represent the mean fold change on transcript or protein level, respectively.
Figure 7
Figure 7. Selective control of CTL metabolism by mTORC1
(a) Volcano plot representation of mean fold changes vs. log-transformed P-values of SLC family members in control versus rapamycin treated CTLs. (b, c) Effects of mTORC1 inhibition in CTLs on glutaminolysis: (b) Volcano plot of changes of glutaminolytic proteins depicted in control versus rapamycin treated CTLs. (c) Glutaminolysis rates in CTLs ± 48 h rapamycin as quantified by measuring the formation of 14CO2 derived from radiolabelled L-glutamine. (d) Comparison of the expression of glycolytic (blue) and OxPhos (red) molecules in control versus rapamycin treated CTLs. (e) Pie charts showing the relative contribution of glycolytic pathway to overall CTL mass in control and rapamycin treated CTLs. (f) KEGG pathway analysis of highest intensity quartile in CTLs with enriched pathways (P<0.01). (g, h) Metabolic flux analysis of control versus rapamycin treated CTL: (g) oxygen consumption and (h) extracellular acidification rate of DMSO and rapamycin trated CTL. Oligomycin (oligo.), 2,4-dinitrophenol (DNP), antimycin A (AA) and rotenone (rot.) were added at indicated time points. (i) Glucose uptake levels in control vs. rapamycin treated CTLs. (j) Effects on decreased glucose flux on lactate output by CTLs. (a, b, d): Each data points represents mean fold change of three biological replicates; P-values determined by two-tailed, unequal variance t-test, measurements based on three biological replicates. (c, i, j): individual data points and means are shown. P-values for non-proteomic data (c, i) determined by paired t-test on non-normalized data. *P<0.05. (g, h) Data shown are mean ± SD. Data based on two (g, h), three (a-f, j) or five (i) biological replicates.
Figure 8
Figure 8. mTORC1 represses PIP3 production and controls the mTORC2 requirement for activation of AKT
(a) Immunoblot analysis of PTEN expression in CTLs cultured ± 48 h rapamycin. (b) HPLC-MS based analysis of PtdIns(3,4,5)P3 levels in control IL-2/IL-12 maintained CTLs (DM) and CTLs treated with PI(3)K p110δ inhibitor IC-87114 (IC, 1 h) and rapamycin for the indicated times. (c) Immunoblot analysis of Akt T308 and S473 phosphorylation levels in CTLs ± 48 h rapamycin. (d, e) The data show immunoblots of Akt T308 phosphorylation in control and mTORC1 inhibited CTLs treated with (d) IC-87114 or (e) AKTi1/2. (f) Immunoblot analysis of PTEN expression in CTLs cultured ± 48 h rapamycin or KU-0063794. (g) HPLC-MS based analysis of PtdIns(3,4,5)P3 levels in control CTLs and CTLs treated with KU-0063794 for indicated durations. (h) Immunoblot analysis of Akt T308, Akt S473, FOXO1/3A T24/T32 phosphorylation and phosphorylation of the mTORC1 substrates S6K T389 and 4EBP1 S65 in CTLs treated with KU-0063794 for the indicated times. (i) Scatter plot depicting correlation of mean (n=3) fold changes in transcript expression from Affymetrix microarray analysis of control CTLs vs CTLs treated with rapamycin (x-axis) or KU-0063794 (y-axis). Immunoblots are representative of at least three biological replicates. (b, g) Individual data points and means are shown. P-values are determined by one-way ANOVA (Holm-Sidak) vs. DMSO (DM) as control. *P<0.05, **P<0.01. Data based on biological triplicates.

Comment in

References

    1. Heng TSP, Painter MW. The Immunological Genome Project: networks of gene expression in immune cells. Nat. Immunol. 2008;9:1091–1094. - PubMed
    1. Schwanhäusser B, et al. Global quantification of mammalian gene expression control. Nature. 2011;473:337–342. - PubMed
    1. Ly T, et al. A proteomic chronology of gene expression through the cell cycle in human myeloid leukemia cells. eLife. 2014;3:e01630. - PMC - PubMed
    1. Larance M, Lamond AI. Multidimensional proteomics for cell biology. Nat. Rev. Mol. Cell Bio. 2015;16:269–280. - PubMed
    1. Geiger T, Wehner A, Schaab C, Cox J, Mann M. Comparative proteomic analysis of eleven common cell lines reveals ubiquitous but varying expression of most proteins. Mol. Cell. Proteomics. 2012;11 M111.014050. - PMC - PubMed

Publication types

Substances

Associated data