

Trends in Coronary Atherosclerosis: A Tale of Two Population Subgroups
- PMID: 26551982
- PMCID: PMC4755914
- DOI: 10.1016/j.amjmed.2015.10.032
Trends in Coronary Atherosclerosis: A Tale of Two Population Subgroups
Abstract
Background: We previously investigated trends in subclinical coronary artery disease and associated risk factors among autopsied non-elderly adults who died from nonnatural causes. Although grade of atherosclerosis declined from 1981 through 2009, the trend was nonlinear, ending in 1995, concurrent with increasing obesity/diabetes in this population. The previous study used linear regression and examined trends for all 4 major epicardial coronary arteries combined. The present investigation of coronary artery disease trends for the period 1995 through 2012 was prompted by a desire for more detailed examination of more recent coronary artery disease trends in light of reports that the epidemics of obesity and diabetes have slowed and are perhaps ending.
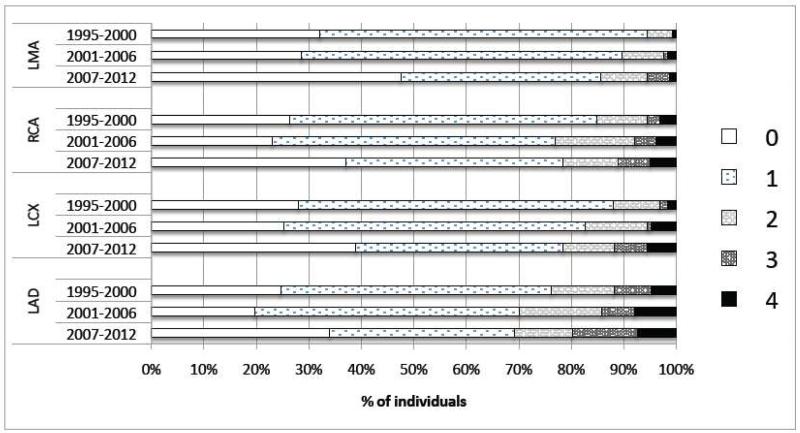
Methods: This population-based series of cross-sectional investigations identified all Olmsted County, Minnesota residents aged 16-64 years who died 1995 through 2012 (N = 2931). For decedents with nonnatural manner of death, pathology reports were reviewed for grade of atherosclerosis assigned each major epicardial coronary artery. Using logistic regression, we estimated calendar-year trends in grade (unadjusted and age- and sex-adjusted) for each artery, initially as an ordinal measure (range, 0-4); then, based on evidence of nonproportional odds, as a dichotomous variable (any atherosclerosis, yes/no) and as an ordinal measure for persons with atherosclerosis (range, 1-4).
Results: Of 474 nonnatural deaths, 453 (96%) were autopsied; 426 (90%) had coronary stenosis graded. In the ordinal-logistic model for trends in coronary artery disease grade (range, 0-4), the proportional odds assumption did not hold. In subsequent analysis as a dichotomous outcome (grades 0 vs 1-4), each artery exhibited a significant temporal decline in the proportion with any atherosclerosis. Conversely, for subjects with coronary artery disease grade 1-4, age- and sex-adjusted ordinal regression revealed no change over time in 2 arteries and statistically significant temporal increases in severity in 2 arteries.
Conclusions: Findings suggest that efforts to prevent coronary artery disease onset have been relatively successful. However, statistically significant increases in the grade of atherosclerosis in 2 arteries among persons with coronary artery disease may be indicative of a major public health challenge.
Keywords: Atherosclerosis; Cardiovascular disease; Subclinical coronary artery disease; Time trends.
Copyright © 2016 Elsevier Inc. All rights reserved.
Figures
Similar articles
-
Recent trends in the prevalence of coronary disease: a population-based autopsy study of nonnatural deaths.Arch Intern Med. 2008 Feb 11;168(3):264-70. doi: 10.1001/archinternmed.2007.79. Arch Intern Med. 2008. PMID: 18268166
-
Contributions of increasing obesity and diabetes to slowing decline in subclinical coronary artery disease.J Am Heart Assoc. 2015 Apr 22;4(4):e001524. doi: 10.1161/JAHA.114.001524. J Am Heart Assoc. 2015. PMID: 25904589 Free PMC article.
-
Time trends in the prevalence of atherosclerosis: a population-based autopsy study.Am J Med. 2001 Mar;110(4):267-73. doi: 10.1016/s0002-9343(00)00709-9. Am J Med. 2001. PMID: 11239844
-
Manifestations of coronary atherosclerosis in young trauma victims--an autopsy study.J Am Coll Cardiol. 1993 Aug;22(2):459-67. doi: 10.1016/0735-1097(93)90050-b. J Am Coll Cardiol. 1993. PMID: 8335815 Review.
-
Unexpected coronary artery findings in mucopolysaccharidosis. Report of four cases and literature review.Cardiovasc Pathol. 2014 May-Jun;23(3):145-51. doi: 10.1016/j.carpath.2014.01.001. Epub 2014 Jan 10. Cardiovasc Pathol. 2014. PMID: 24508139 Review.
Cited by
-
Assessment and management of the heightened risk for atherosclerotic cardiovascular events in patients with lupus erythematosus or dermatomyositis.Int J Womens Dermatol. 2021 Sep 9;7(5Part A):560-575. doi: 10.1016/j.ijwd.2021.08.015. eCollection 2021 Dec. Int J Womens Dermatol. 2021. PMID: 35024413 Free PMC article. Review.
-
Which aortic clamp strategy is better to reduce postoperative stroke and death: Single center report and a meta-analysis.Medicine (Baltimore). 2018 Mar;97(12):e0221. doi: 10.1097/MD.0000000000010221. Medicine (Baltimore). 2018. PMID: 29561451 Free PMC article.
-
Post-mortem evidence of a diverse distribution pattern of atherosclerosis in the South African population.Sci Rep. 2022 Jul 5;12(1):11366. doi: 10.1038/s41598-022-15671-z. Sci Rep. 2022. PMID: 35790821 Free PMC article.
-
Multiple Infectious Agents and the Origins of Atherosclerotic Coronary Artery Disease.Front Cardiovasc Med. 2016 Sep 12;3:30. doi: 10.3389/fcvm.2016.00030. eCollection 2016. Front Cardiovasc Med. 2016. PMID: 27672638 Free PMC article. Review.
-
Id-1 Promotes Reendothelialization In The Early Phase After Vascular Injury Through Activation Of NFkB/survivin Signaling Pathway.Drug Des Devel Ther. 2019 Oct 31;13:3799-3811. doi: 10.2147/DDDT.S208707. eCollection 2019. Drug Des Devel Ther. 2019. PMID: 31802852 Free PMC article.
References
-
- National Center for Health Statistics . Age-adjusted death rates for selected causes, death registration states, 1900-32, and United States, 1933-1998. National Center for Health Statistics. National Vital Statistics System; Hyattsville, MD: [Accessed May 5, 2015]. http://www.cdc.gov/nchs/nvss/mortality/hist293.htm.
-
- National Center for Health Statistics. National Vital Statistics Reports . Deaths: Final Data. Miscellaneous years, 1999-2010. National Center for Health Statistics; Hyattsville, MD:
-
- National Center for Health Statistics . National Vital Statistics Report (NVSR) Deaths: Final Data for 2011. 3. Vol. 63. National Center for Health Statistics; Hyattsville, MD: [Accessed May 5, 2015]. http://www.cdc.gov/nchs/data_access/Vitalstatsonline.htm.
-
- Towfighi A, Markovic D, Ovbiagele B. National gender-specific trends in myocardial infarction hospitalization rates among patients aged 35 to 64 years. Am J Cardiol. 2011;108:1102–1107. - PubMed
-
- Arciero TJ, Jacobsen SJ, Reeder GS, et al. Temporal trends in the incidence of coronary disease. Am J Med. 2004;117(4):228–33. - PubMed
Publication types
MeSH terms
Grants and funding
LinkOut - more resources
Full Text Sources
Other Literature Sources
Medical
