

Inhibition of STAT3 activity delays obesity-induced thyroid carcinogenesis in a mouse model
- PMID: 26552408
- PMCID: PMC4671368
- DOI: 10.1530/ERC-15-0417
Inhibition of STAT3 activity delays obesity-induced thyroid carcinogenesis in a mouse model
Abstract
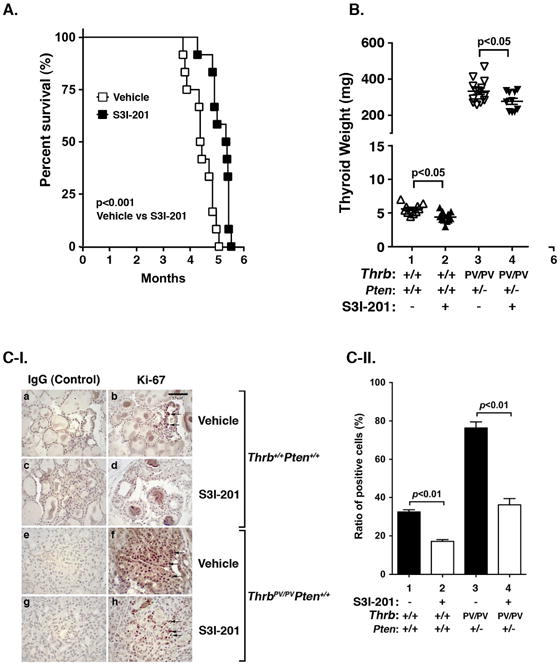
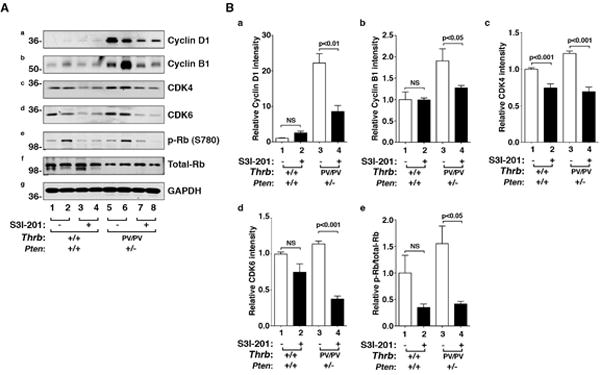
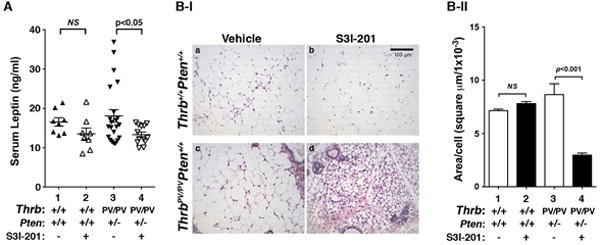
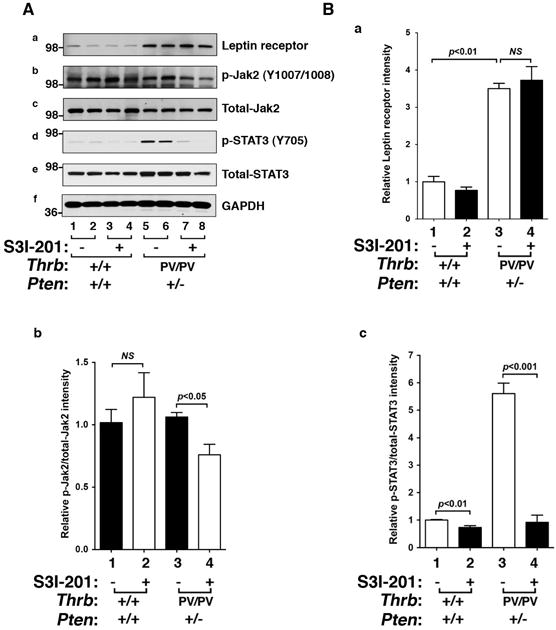
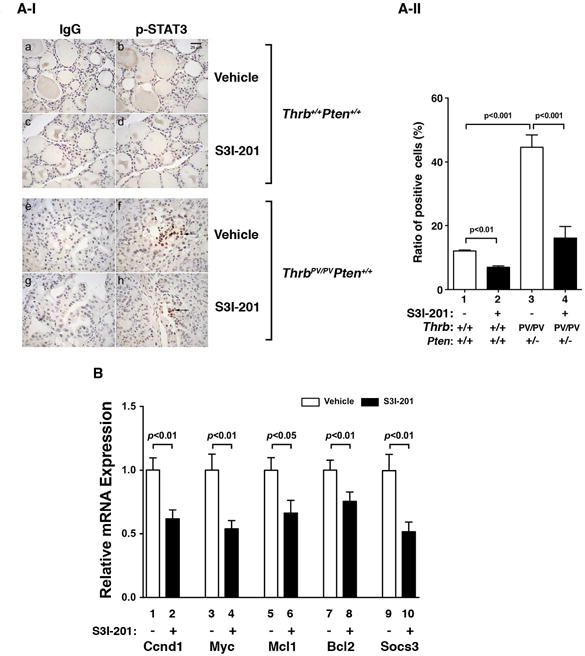
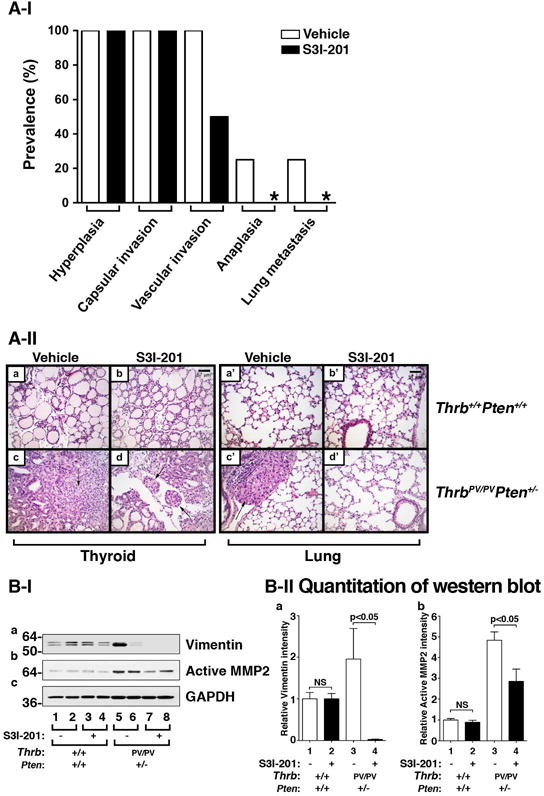
Compelling epidemiologic studies indicate that obesity is a risk factor for many human cancers, including thyroid cancer. In recent decades, the incidence of thyroid cancer has dramatically increased along with a marked rise in obesity prevalence. We previously demonstrated that a high fat diet (HFD) effectively induced the obese phenotype in a mouse model of thyroid cancer (Thrb(PV/PV)Pten(+/-) mice). Moreover, HFD activates the STAT3 signal pathway to promote more aggressive tumor phenotypes. The aim of the present study was to evaluate the effect of S3I-201, a specific inhibitor of STAT3 activity, on HFD-induced aggressive cancer progression in the mouse model of thyroid cancer. WT and Thrb(PV/PV)Pten(+/-) mice were treated with HFD together with S3I-201 or vehicle-only as controls. We assessed the effects of S3I-201 on HFD-induced thyroid cancer progression, the leptin-JAK2-STAT3 signaling pathway, and key regulators of epithelial-mesenchymal transition (EMT). S3I-201 effectively inhibited HFD-induced aberrant activation of STAT3 and its downstream targets to markedly inhibit thyroid tumor growth and to prolong survival. Decreased protein levels of cyclins D1 and B1, cyclin dependent kinase 4 (CDK4), CDK6, and phosphorylated retinoblastoma protein led to the inhibition of tumor cell proliferation in S3I-201-treated Thrb(PV/PV)Pten(+/-) mice. Reduced occurrence of vascular invasion and blocking of anaplasia and lung metastasis in thyroid tumors of S3I-201-treated Thrb(PV/PV)Pten(+/-) mice were mediated via decreased expression of vimentin and matrix metalloproteinases, two key effectors of EMT. The present findings suggest that inhibition of the STAT3 activity would be a novel treatment strategy for obesity-induced thyroid cancer.
Keywords: JAK2-STAT3 signaling; Pten-deficiency; STAT3 inhibitor; obesity; preclinical mouse model; thyroid cancer; thyroid hormone receptor β mutant.
© 2016 Society for Endocrinology.
Conflict of interest statement
The authors have nothing to disclose.
Figures
Similar articles
-
Diet-induced obesity increases tumor growth and promotes anaplastic change in thyroid cancer in a mouse model.Endocrinology. 2013 Aug;154(8):2936-47. doi: 10.1210/en.2013-1128. Epub 2013 Jun 7. Endocrinology. 2013. PMID: 23748362 Free PMC article.
-
Metformin and JQ1 synergistically inhibit obesity-activated thyroid cancer.Endocr Relat Cancer. 2018 Oct;25(10):865-877. doi: 10.1530/ERC-18-0071. Epub 2018 Jun 18. Endocr Relat Cancer. 2018. PMID: 29914872 Free PMC article.
-
Inhibition of STAT3 signaling blocks obesity-induced mammary hyperplasia in a mouse model.Am J Cancer Res. 2017 Mar 1;7(3):727-739. eCollection 2017. Am J Cancer Res. 2017. PMID: 28401024 Free PMC article.
-
Extranuclear signaling of mutated thyroid hormone receptors in promoting metastatic spread in thyroid carcinogenesis.Steroids. 2011 Aug;76(9):885-91. doi: 10.1016/j.steroids.2011.03.016. Epub 2011 Apr 5. Steroids. 2011. PMID: 21473875 Free PMC article. Review.
-
New insights into regulation of lipid metabolism by thyroid hormone.Curr Opin Endocrinol Diabetes Obes. 2010 Oct;17(5):408-13. doi: 10.1097/MED.0b013e32833d6d46. Curr Opin Endocrinol Diabetes Obes. 2010. PMID: 20644471 Free PMC article. Review.
Cited by
-
Sanguinarine Induces Apoptosis in Papillary Thyroid Cancer Cells via Generation of Reactive Oxygen Species.Molecules. 2020 Mar 9;25(5):1229. doi: 10.3390/molecules25051229. Molecules. 2020. PMID: 32182833 Free PMC article.
-
Mechanistic Aspects of Inflammation and Oxidative Stress and Their Association With Thyroid Cancer Risk.Cancer Med. 2025 Jul;14(13):e71030. doi: 10.1002/cam4.71030. Cancer Med. 2025. PMID: 40620232 Free PMC article. Review.
-
Five genes influenced by obesity may contribute to the development of thyroid cancer through the regulation of insulin levels.PeerJ. 2020 Jul 28;8:e9302. doi: 10.7717/peerj.9302. eCollection 2020. PeerJ. 2020. PMID: 33240576 Free PMC article.
-
Novel leptin OB3 peptide-induced signaling and progression in thyroid cancers: Comparison with leptin.Oncotarget. 2016 May 10;7(19):27641-54. doi: 10.18632/oncotarget.8505. Oncotarget. 2016. PMID: 27050378 Free PMC article.
-
Impact of Overweight and Obesity on US Papillary Thyroid Cancer Incidence Trends (1995-2015).J Natl Cancer Inst. 2020 Aug 1;112(8):810-817. doi: 10.1093/jnci/djz202. J Natl Cancer Inst. 2020. PMID: 31638139 Free PMC article.
References
-
- Ai T, Wang Z, Zhang M, Zhang L, Wang N, Li W, Song L. Expression and prognostic relevance of STAT3 and cyclin D1 in non-small cell lung cancer. Int J Biol Markers. 2012;27:e132–138. - PubMed
-
- Akinci M, Kosova F, Cetin B, Aslan S, Ari Z, Cetin A. Leptin levels in thyroid cancer. Asian J Surg. 2009;32:216–223. - PubMed
-
- Alvarez JV, Febbo PG, Ramaswamy S, Loda M, Richardson A, Frank DA. Identification of a genetic signature of activated signal transducer and activator of transcription 3 in human tumors. Cancer Res. 2005;65:5054–5062. - PubMed
-
- Bowman T, Garcia R, Turkson J, Jove R. STATs in oncogenesis. Oncogene. 2000;19:2474–2488. - PubMed
Publication types
MeSH terms
Substances
Grants and funding
LinkOut - more resources
Full Text Sources
Other Literature Sources
Medical
Research Materials
Miscellaneous
