The genetics of feed conversion efficiency traits in a commercial broiler line
- PMID: 26552583
- PMCID: PMC4639841
- DOI: 10.1038/srep16387
The genetics of feed conversion efficiency traits in a commercial broiler line
Abstract
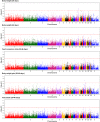
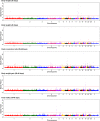
Individual feed conversion efficiency (FCE) is a major trait that influences the usage of energy resources and the ecological footprint of livestock production. The underlying biological processes of FCE are complex and are influenced by factors as diverse as climate, feed properties, gut microbiota, and individual genetic predisposition. To gain an insight to the genetic relationships with FCE traits and to contribute to the improvement of FCE in commercial chicken lines, a genome-wide association study was conducted using a commercial broiler population (n = 859) tested for FCE and weight traits during the finisher period from 39 to 46 days of age. Both single-marker (generalized linear model) and multi-marker (Bayesian approach) analyses were applied to the dataset to detect genes associated with the variability in FCE. The separate analyses revealed 22 quantitative trait loci (QTL) regions on 13 different chromosomes; the integration of both approaches resulted in 7 overlapping QTL regions. The analyses pointed to acylglycerol kinase (AGK) and general transcription factor 2-I (GTF2I) as positional and functional candidate genes. Non-synonymous polymorphisms of both candidate genes revealed evidence for a functional importance of these genes by influencing different biological aspects of FCE.
Conflict of interest statement
All authors declare no competing financial interests, except RH who is employed by Cobb-Vantress, Inc. Cobb-Vantress is involved in broiler breeding and research in genetic improvement of broilers lines.
Figures


References
-
- Donohue M. & Cunningham D. Effects of grain and oilseed prices on the costs of US poultry production. J. Appl. Poult. Res. 18, 325–337 (2009).
-
- Nkrumah J. D. et al. Relationships of feedlot feed efficiency, performance, and feeding behavior with metabolic rate, methane production, and energy partitioning in beef cattle. J. Anim. Sci. 84, 145–153 (2006). - PubMed
-
- Barea R. et al. Energy utilization in pigs selected for high and low residual feed intake. J. Anim. Sci. 88, 2062–2072 (2010). - PubMed
-
- Havenstein G., Ferket P. & Qureshi M. Growth, livability, and feed conversion of 1957 versus 2001 broilers when fed representative 1957 and 2001 broiler diets. Poult. Sci. 82, 1500–1508 (2003). - PubMed
MeSH terms
LinkOut - more resources
Full Text Sources
Other Literature Sources
Molecular Biology Databases
Miscellaneous

