. 2016 Feb;16(3):381-92.
doi: 10.1002/pmic.201500264. Epub 2016 Jan 7.

Micro-proteomics with iterative data analysis: Proteome analysis in C. elegans at the single worm level

Affiliations

Micro-proteomics with iterative data analysis: Proteome analysis in C. elegans at the single worm level

Dalila Bensaddek et al. Proteomics. 2016 Feb.

Abstract

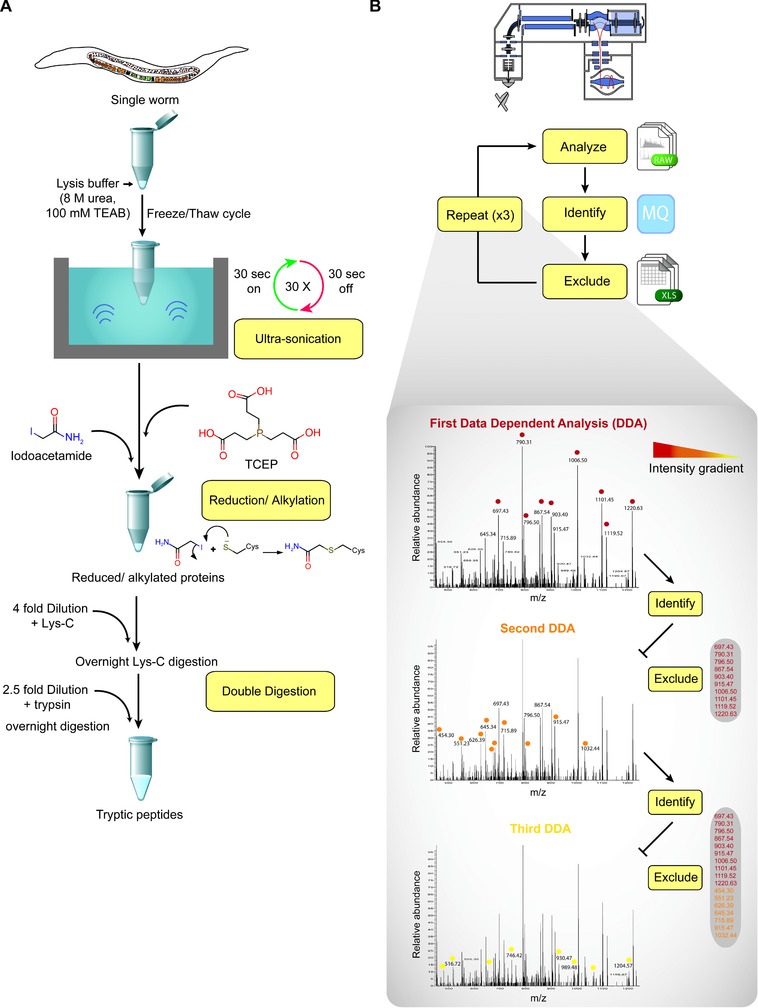
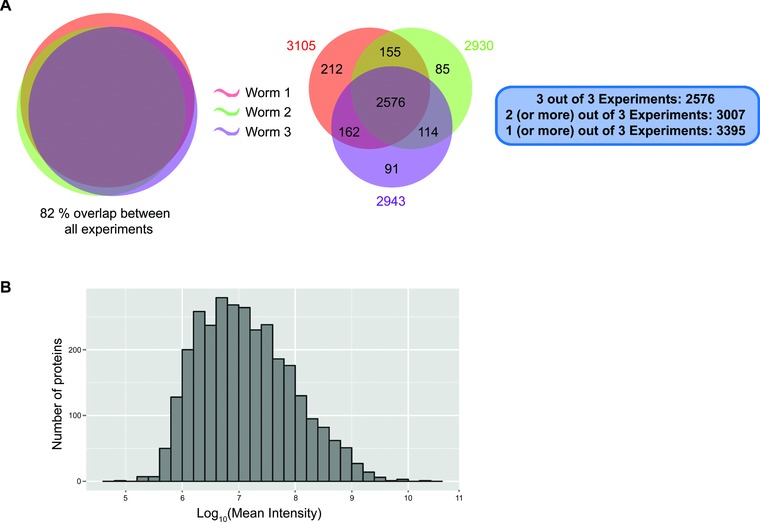
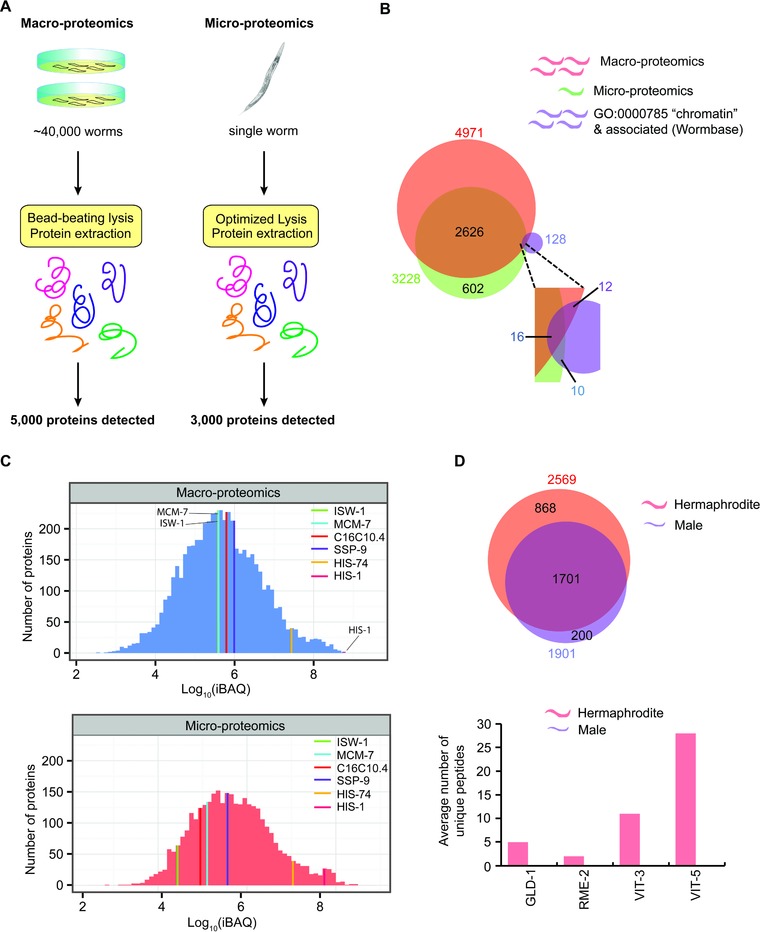
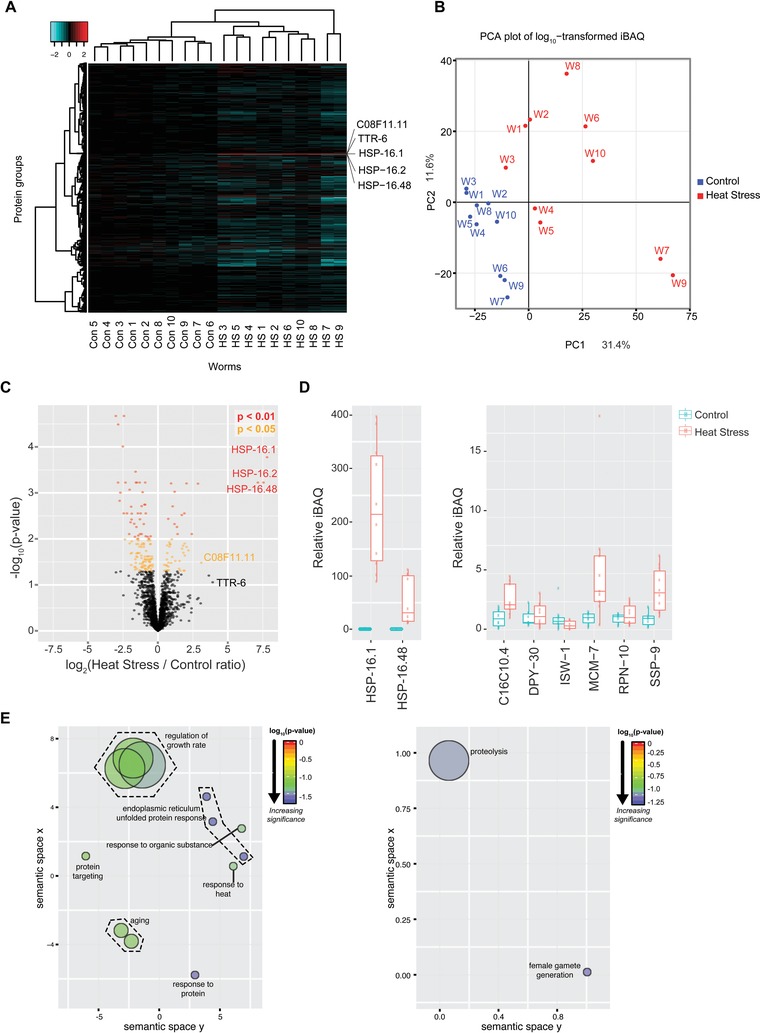
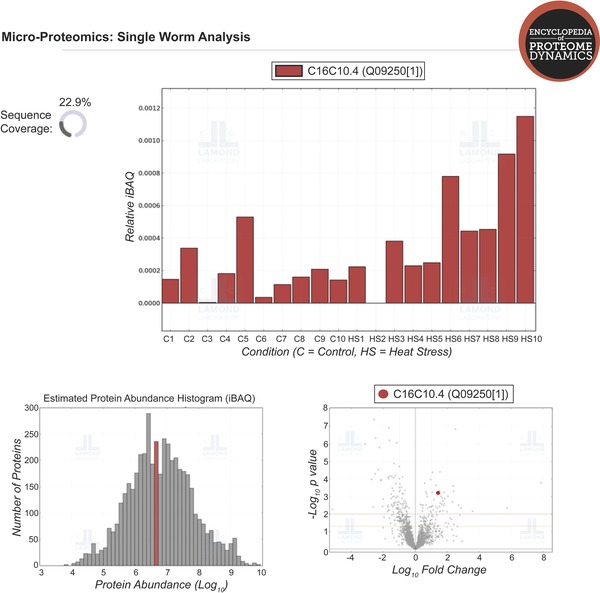
Proteomics studies typically analyze proteins at a population level, using extracts prepared from tens of thousands to millions of cells. The resulting measurements correspond to average values across the cell population and can mask considerable variation in protein expression and function between individual cells or organisms. Here, we report the development of micro-proteomics for the analysis of Caenorhabditis elegans, a eukaryote composed of 959 somatic cells and ∼1500 germ cells, measuring the worm proteome at a single organism level to a depth of ∼3000 proteins. This includes detection of proteins across a wide dynamic range of expression levels (>6 orders of magnitude), including many chromatin-associated factors involved in chromosome structure and gene regulation. We apply the micro-proteomics workflow to measure the global proteome response to heat-shock in individual nematodes. This shows variation between individual animals in the magnitude of proteome response following heat-shock, including variable induction of heat-shock proteins. The micro-proteomics pipeline thus facilitates the investigation of stochastic variation in protein expression between individuals within an isogenic population of C. elegans. All data described in this study are available online via the Encyclopedia of Proteome Dynamics (http://www.peptracker.com/epd), an open access, searchable database resource.

Keywords: Caenorhabditis elegans; Heat-shock; Micro-proteomics; Nematode; Single worm proteomics; Technology.


Figures

Figure 1
Figure 1
Schematic representation of the micro‐proteomics workflow. (A) Overview of the “one pot” lysis and digestion method. The single worm is placed in a microfuge tube containing lysis buffer and lysed in a sonication water bath. Extracted proteins are reduced and alkylated, then subjected to double digestion using trypsin and lys‐C. (B) Schematic representation of the iterative data acquisition. The proteolytic peptides are divided into three aliquots. The first is analyzed by LC‐MS/MS using standard data‐dependent acquisition and the identified peptides are used to generate an exclusion list. The second aliquot is analyzed using data‐dependent acquisition with the exclusion list generated above. Finally, the third aliquot is analyzed using data dependent acquisition with the concatenated exclusion list from DDA1 and DDA2.
Figure 2
Figure 2
Summary of micro‐proteomics results. (A) Venn diagram comparing the proteins identified from three individual worms using the micro‐proteomics workflow and iterative data acquisition. (B) Distribution of protein intensities in the single worm dataset.
Figure 3
Figure 3
Comparison of micro‐proteomics and macro‐proteomics analysis of C. elegans. (A) Comparison of number of worms required and overall number of proteins identified. (B) Venn diagram comparing the total number of proteins and chromatin‐associated proteins identified in the macro‐proteomics and the micro‐proteomics studies. (C) Comparison of the dynamic range of expression levels of proteins identified in each study. (D) Venn diagram comparing the numbers of proteins identified in the hermaphrodite worm and the male worm.
Figure 4
Figure 4
Proteomic analysis of the response of individual worms to heat‐stress. (A) Heatmap of the log10 ratio of iBAQ values calculated for proteins identified from ten control (Con) and ten heat‐shocked (HS) worms for each protein group relative to the mean iBAQ value for the ten control worms; only proteins groups detected in all 20 worms are shown. (B) Q‐mode PCA plot based on the log10 iBAQ profile of the ten control (Con, blue) and ten heat‐shocked (HS, red) worms (W); only two principal components are represented (43% of total variance). (C) Volcano plot of the log2 ratio of mean heat‐stress to control iBAQ values plotted against the negative log10 ratio of the p‐value calculated using a t‐test. The graph is colour coded to indicate the level of significance. (D) Boxplot of the untransformed iBAQ values for ten control (Con) and ten heat‐shocked (HS) worms, relative to the mean value for the ten control worms, for the indicated proteins. (E) Schematic representation of the GO‐term enrichment analysis. GO‐term enrichment analysis was performed using DAVID (ref) for up‐ and down‐regulated proteins (p‐value < 0.05; FDR < 1%) after heat‐stress. The DAVID output was further analyzed using ReviGo and plotted using R.
Figure 5
Figure 5
Screenshot showing an example of data visualization available via the Encyclopedia of Protein Dynamics. The EPD (http://www.peptracker.com/epd) is an open access, searchable database of proteomic data.

References

    1. Beck, M. , Claassen, M. , Aebersold, R. , Comprehensive proteomics. Curr. Opin. Biotechnol. 2011, 22, 3–8. - PubMed
    1. Nagaraj, N. , Alexander Kulak, N. , Cox, J. , Neuhauser, N. et al., System‐wide perturbation analysis with nearly complete coverage of the yeast proteome by single‐shot ultra HPLC runs on a bench top orbitrap. Mol. Cell. Proteomics 2012, 11, M111.013722. - PMC - PubMed
    1. Hebert, A. S. , Richards, A. L. , Bailey, D. J. , Ulbrich, A. et al., The one hour yeast proteome. Mol. Cell. Proteomics 2014, 13, 339–347. - PMC - PubMed
    1. Geiger, T. , Wehner, A. , Schaab, C. , Cox, J. , Mann, M. , Comparative proteomic analysis of eleven common cell lines reveals ubiquitous but varying expression of most proteins. Mol. Cell. Proteomics 2012, 11, M111.014050. - PMC - PubMed
    1. Dephoure, N. , Gould, K. L. , Gygi, S. P. , Kellogg, D. R. , Mapping and analysis of phosphorylation sites: a quick guide for cell biologists. Mol. Biol. Cell 2013, 24, 535–542. - PMC - PubMed

Publication types

MeSH terms