. 2015 Nov 16;212(12):2133-46.
doi: 10.1084/jem.20150057. Epub 2015 Nov 9.

CLEC-2 in megakaryocytes is critical for maintenance of hematopoietic stem cells in the bone marrow

Affiliations

CLEC-2 in megakaryocytes is critical for maintenance of hematopoietic stem cells in the bone marrow

Ayako Nakamura-Ishizu et al. J Exp Med. .

Erratum in

Abstract

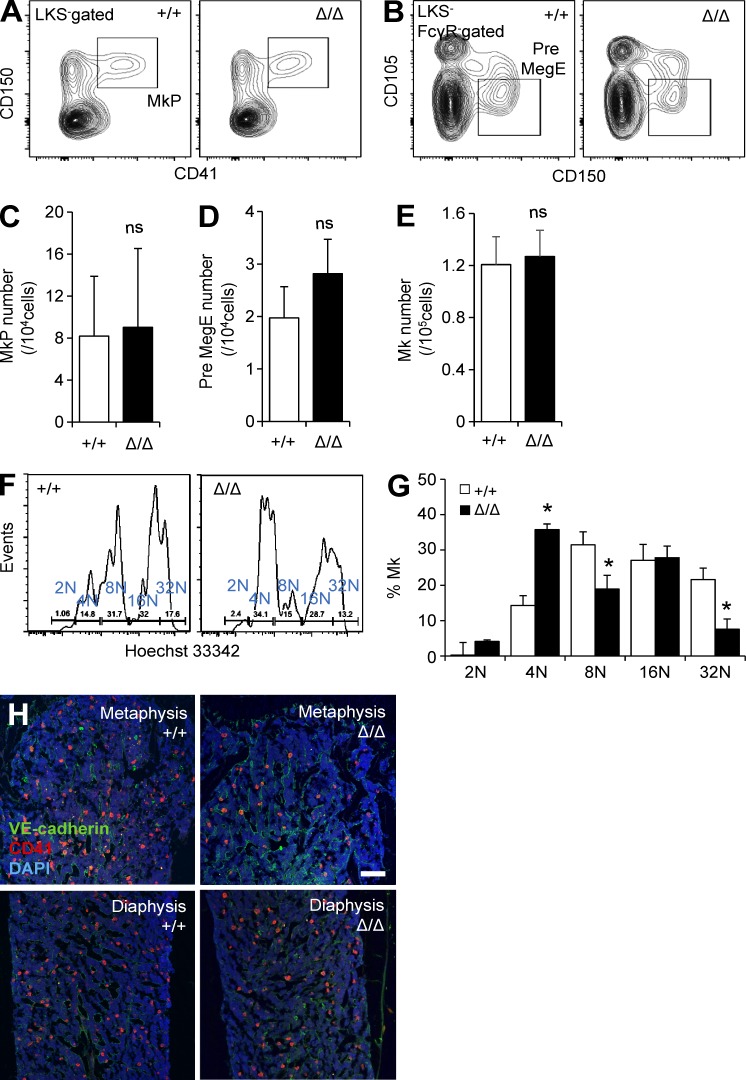
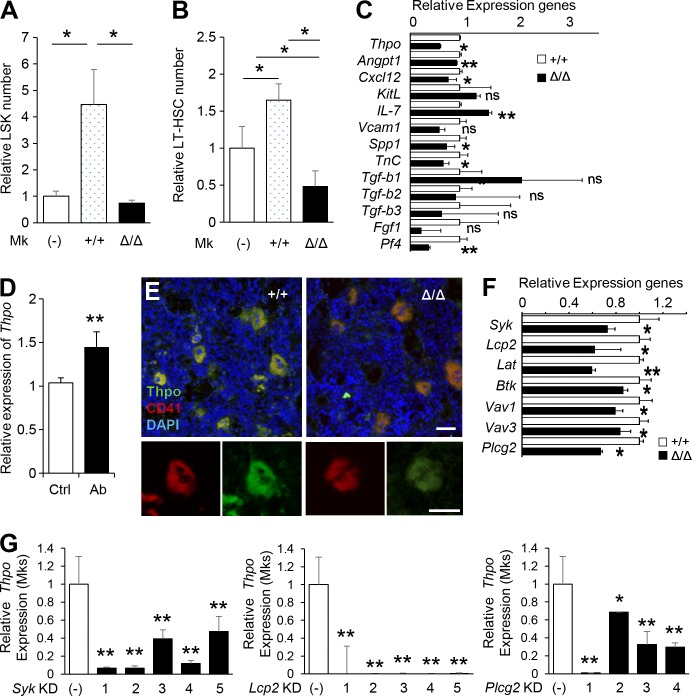
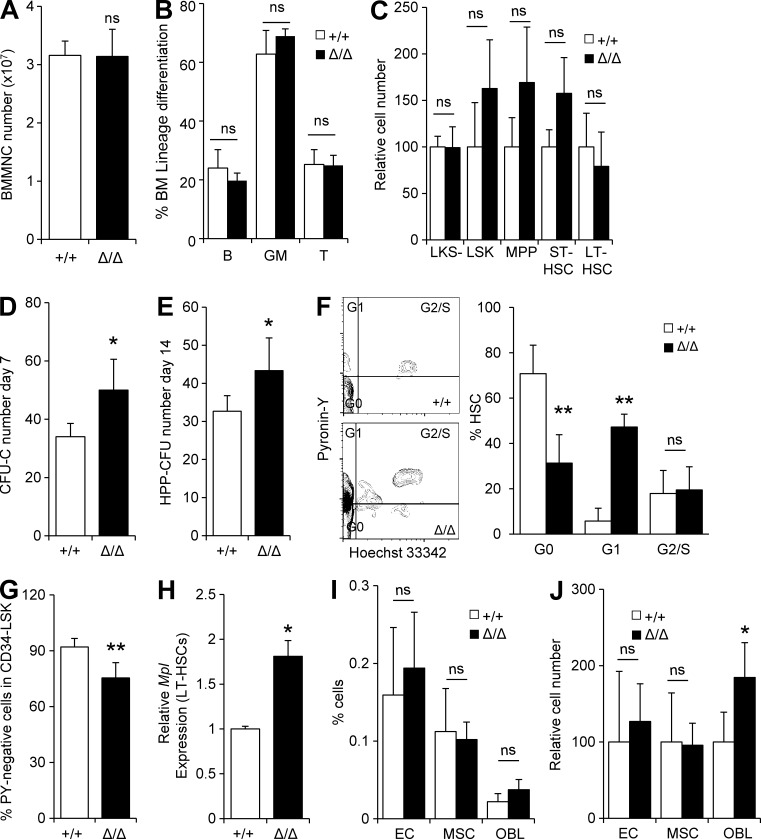
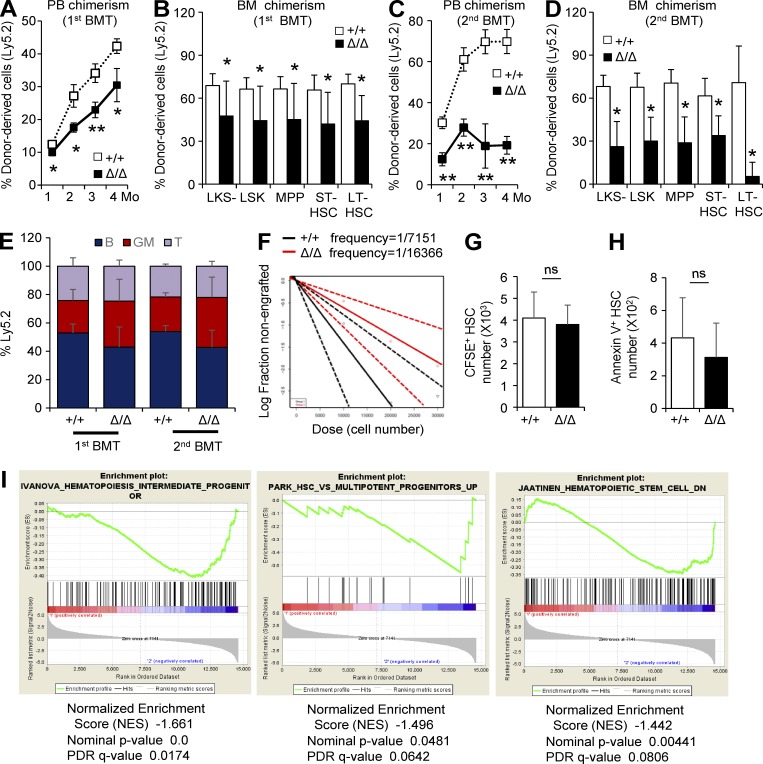
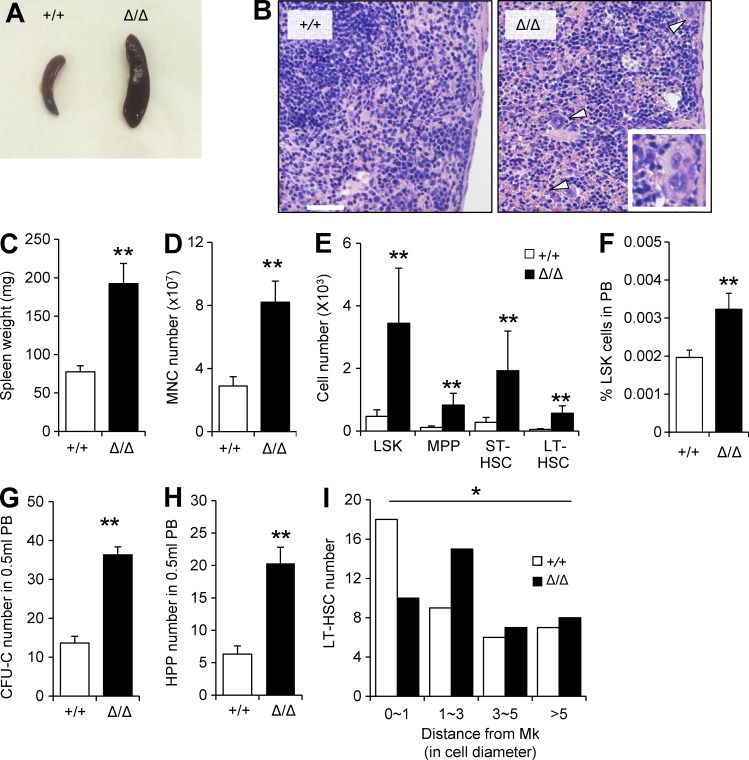
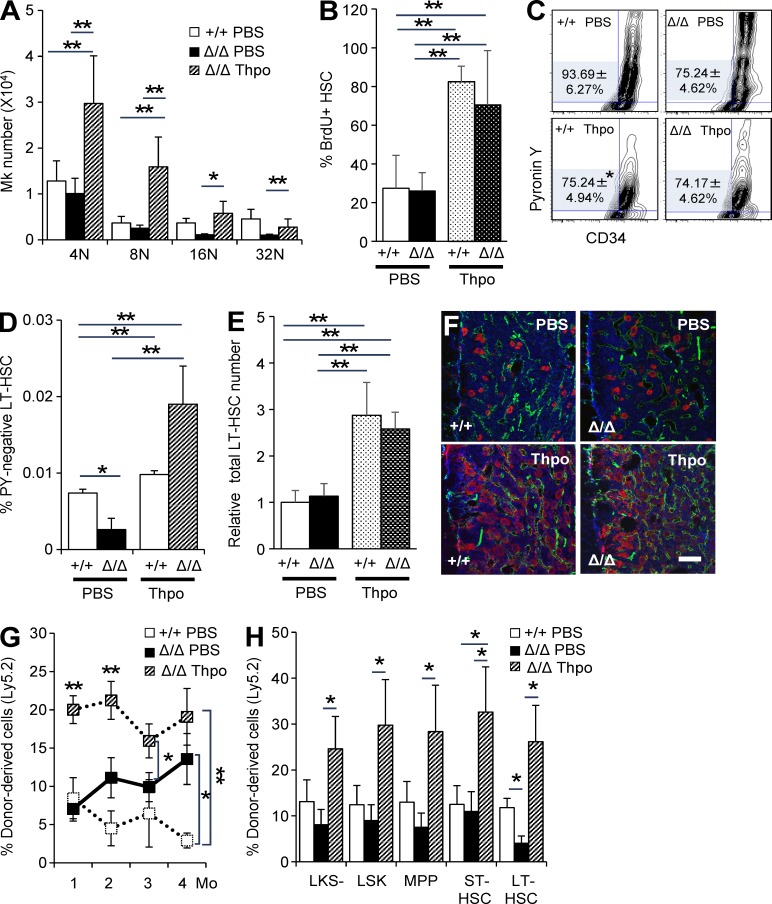
Hematopoietic stem cells (HSCs) depend on the bone marrow (BM) niche for their maintenance, proliferation, and differentiation. The BM niche is composed of nonhematopoietic and mature hematopoietic cells, including megakaryocytes (Mks). Thrombopoietin (Thpo) is a crucial cytokine produced by BM niche cells. However, the cellular source of Thpo, upon which HSCs primarily depend, is unclear. Moreover, no specific molecular pathway for the regulation of Thpo production in the BM has been identified. Here, we demonstrate that the membrane protein C-type lectin-like receptor-2 (CLEC-2) mediates the production of Thpo and other factors in Mks. Mice conditionally deleted for CLEC-2 in Mks (Clec2(MkΔ/Δ)) produced lower levels of Thpo in Mks. CLEC-2-deficient Mks showed down-regulation of CLEC-2-related signaling molecules Syk, Lcp2, and Plcg2. Knockdown of these molecules in cultured Mks decreased expression of Thpo. Clec2(MkΔ/Δ) mice exhibited reduced BM HSC quiescence and repopulation potential, along with extramedullary hematopoiesis. The low level of Thpo production may account for the decline in HSC potential in Clec2(MkΔ/Δ) mice, as administration of recombinant Thpo to Clec2(MkΔ/Δ) mice restored stem cell potential. Our study identifies CLEC-2 signaling as a novel molecular mechanism mediating the production of Thpo and other factors for the maintenance of HSCs.


Figures

Figure 1.
Figure 1.
CLEC-2 is expressed in Mks and is specifically deleted in Mks of Clec2MkΔ/Δ mice. (A) IHC of BM of 10-wk-old wild-type mice. CLEC-2 stains for VE-cadherin–positive ECs (arrowheads) and VE-cadherin–negative Mks (arrows). Enlargement of the dotted box is shown in the top right panel. CLEC-2 stains for CD41-positive Mks (bottom right). (B) Relative expression of CLEC-2 (Clec1b) transcripts in various hematopoietic cells. (C) Calculation of mean fluorescence ratios of CLEC-2 in various HSPC populations as measured by flow cytometry. (D and E) Mean fluorescence intensity of various hematopoietic (D) and niche (E) cells. (B–E) Means ± SD. n = 4; two independent experiments. *, P < 0.05; and **, P < 0.01 by Tukey’s test. (F) Detection of Clec2 deletion by genomic PCR. An intact exon yields a 2,500-bp product, whereas removal of floxed exon 1 results in a 1,200-bp product. (G) Expression of CLEC-2 in platelets and LT-HSCs from Clec2MkΔ/Δ (Δ/Δ) and Clec2+/+ (+/+) mice. Red, CLEC-2 antibody-stained; blue, isotype control. Means ± SD. n = 5; two independent experiments. P = 0.0078 for platelets and P = 0.69 for LT-HSCs by Student’s t test. (H) IHC of BM staining CLEC-2 and VE-cadherin in Clec2MkΔ/Δ (Δ/Δ) mice. Bars: (A and H) 100 µm; (A, top right) 25 µm. (I) Measurement of PB parameters in Clec2MkΔ/Δ (Δ/Δ) and Clec2+/+ (+/+) mice. Means ± SD. n = 5; three independent experiments. P-values as indicated by Student’s t test.
Figure 2.
Figure 2.
Altered distribution of Mks in BM of Clec2MkΔ/Δ mice. (A and B) Representative flow cytometric plots showing Mk progenitor cell population (MkP: LincKit+Sca-1[LKS] CD150+CD41+; Pre-MegE: LKSFcγRCD105+CD150+) in Clec2MkΔ/Δ (Δ/Δ) and Clec2+/+ (+/+) mice. (C–E) Number of MkP (C), Pre-MegE (D), and CD41+ Mks (E) in Δ/Δ and +/+ mice. Means ± SD. n = 5; two independent experiments. ns, P = 0.46 for C, P = 0.24 for D, and P = 0.24 for E by Student’s t test. (F and G) Representative flow cytometric plot showing Mks (F) and Mk frequency within the total Mk population (G), based on ploidy analysis of +/+ and Δ/Δ mice. Means ± SD. n = 4; two independent experiments. *, P < 0.05 by Tukey’s test. (H) IHC of BM, staining for ECs (VE-cadherin), Mks (CD41), and DAPI in the metaphysis and diaphysis of +/+ and Δ/Δ mice. Bar, 100 µm.
Figure 3.
Figure 3.
CLEC-2positive Mks produce Thpo. (A and B) Effect of 3 d of co-culture with Mks from Δ/Δ or +/+ mice on LSK cells (A) and LT-HSCs (B). Means ± SD. n = 4; two independent experiments. *, P < 0.05 by Tukey’s test. (C) Relative levels of niche factor (Thpo, Angpt1, Cxcl12, KitL, IL-7, Vcam1, Spp1, TnC, Tgf-b1, Tgf-b2, Tgf-b3, Fgf1, and Pf4) transcripts in Mks from Δ/Δ mice compared with +/+ mice. (D) Relative levels of Thpo transcripts were significantly up-regulated in cultured Mks treated with a CLEC-2 stimulatory antibody. (E) IHC of BM from +/+ and Δ/Δ mice. Mks, which are CD41, exhibit lower Thpo levels in CLEC-2–deficient Mks. Magnification of a representative Mk is shown in the bottom panels. Bars: (top) 50 µm; (bottom) 100 µm. (F) Gene expression of CLEC-2 downstream pathway molecules in Mks from +/+ and Δ/Δ mice. (G) Knockdown of Syk, Lcp2, and Plcg2 results in reduced expression of Thpo transcript in Mks. (C, D, F, and G) Means ± SD. n = 4; two independent experiments. ns, P > 0.05; *, P < 0.05; and **, P < 0.01 by Student’s t test.
Figure 4.
Figure 4.
HSCs from Clec2MkΔ/Δ mice exhibit reduced stem cell quiescence. (A–C) Number of BM MNCs (A), lineage composition in the BM (B), and relative number of BM HSPCs (C) in +/+ and Δ/Δ mice. (D and E) CFU-C number (D) and HPP-CFC number (E) of 500 HSCs from Δ/Δ and +/+ mice. (A–E) Means ± SD. n = 6; two independent experiments. ns, P > 0.05; and *, P < 0.05 by Student’s t test. (F) Cell cycle analysis using Pyronin Y and Hoechst 33342 staining of CD34 LSK cells in +/+ and Δ/Δ mice. (G) Cell cycle state of CD34 LSK cells with Pyronin Y staining in +/+ and Δ/Δ mice. (H) Relative levels of Mpl transcripts in LT-HSCs from +/+ and Δ/Δ mice. (I and J) Number (I) and frequency (J) of ECs (CD45Ter119CD31+), MSCs (CD45Ter119Sca-1+ALCAM), and OBLs (CD45Ter119CD31Sca-1ALCAM+) in Δ/Δ and +/+ mice. (F–J) Means ± SD. n = 4; two independent experiments. ns, P > 0.05; *, P < 0.05; and **, P < 0.01 by Student’s t test.
Figure 5.
Figure 5.
HSCs from Clec2MkΔ/Δ mice exhibit reduced repopulation capacity. (A and C) Percentage of donor-derived cells (Ly5.2) in PB after the first and second BMT at the indicated time intervals (in months). (B and D) Percentage of donor-derived cells (Ly5.2) in BM HSPCs after the first and second BMT at the indicated time intervals (in months). (A–D) Means ± SEM. n = 6; two independent experiments. *, P < 0.05; and **, P < 0.01 by Student’s t test. (E) Lineage composition of Ly5.2 MNCs in recipient mice. Means ± SEM. n = 6; two independent experiments. P > 0.05 in all groups by Student’s t test. (F) Extreme limiting dilution assay of BM MNCs from Δ/Δ and +/+ mice. n = 7; two independent experiments. P = 0.0432 by Pearson’s χ2 test. (G) Number of CFSE staining LT-HSCs from Δ/Δ and +/+ mice homing to the BM 24 h after BMT. Note that no significant difference was present in homing capacity of HSCs from Δ/Δ and +/+ mice. (H) Number of Annexin V+ HSCs in Δ/Δ and +/+ mice. (G and H) Means ± SD. n = 4; two independent experiments. ns, P = 0.677 (G) or P = 0.48 (H) by Student’s t test. (I) Gene set enrichment analysis of LT-HSCs from Δ/Δ and +/+ mice (n = 10). Genes expressed by intermediate and multipotent progenitors were significantly up-regulated in LT-HSCs from Δ/Δ mice (plots are second and third from left). Statistical analysis is as shown in figure.
Figure 6.
Figure 6.
Loss of HSC quiescence in HSCs in Clec2MkΔ/Δ mice is Mk specific. (A) Scheme of the experimental model for BMT. 8 × 10⁶ BM MNCs from Δ/Δ and +/+ mice were transplanted into lethally irradiated (Ly5.1) mice along with Ly5.1-positive 2 × 10⁶ BM MNCs. (B) Percentage of Ly5.2-positive Mks in BMs of recipient mice. (C) Relative number of Ly5.1-positive HSPCs in recipient mice. (B and C) Means ± SD. n = 10; two independent experiments. ns, P = 0.167; *, P < 0.05; and **, P < 0.01 by Student’s t test. (D) Ly5.1+ Pyronin Y–negative cells in CD34 LSK cells in the BMs of recipient mice. (E) Ly5.1+ Pyronin Y–negative cells in CD34+ LSK cells in the BMs of recipient mice. (D and E) Means ± SD. n = 5; two independent experiments. **, P < 0.01 by Student’s t test. (F) Ratio of fluorescence intensity of Ki67 and TOTO-3 on single sorted cells in Ly5.1+ or Ly5.2+ HSCs in chimeric mice. Means ± SEM. n = 50; two independent experiments. **, P < 0.01 by Student’s t test.
Figure 7.
Figure 7.
Clec2MkΔ/Δ mice exhibit extramedullary hematopoiesis and elevated mobilization of HSCs into PB. (A and B) Gross appearance (A) and hematoxylin and eosin staining (B) of spleens from +/+ and Δ/Δ mice. Arrowheads indicate the presence of Mks in Clec2Mk+/+ spleens. Magnification of an Mk is shown in the inset. Bar, 200 µm. (C–E) Analysis of spleen of Δ/Δ and +/+ mice. Spleen weight (C), total MNC number (D), and absolute populations of various HSPC fractions (E) are significantly higher in spleens of Clec2MkΔ/Δ compared with Clec2Mk+/+ mice. (F–H) Percentage of LSK cells (F), CFU-C number (G), and HPP-CFC number (H) in PB of +/+ and Δ/Δ mice. (C–H) Means ± SD. n = 6; two independent experiments. **, P < 0.01 by Student’s t test. (I) Quantitation of distance of LT-HSCs from Mks in +/+ and Δ/Δ mice. Means ± SD. n = 6; two independent experiments. *, P = 0.038 by Tukey’s test.
Figure 8.
Figure 8.
Maintenance of HSC quiescence requires Thpo produced by CLEC-2–positive Mks. (A) Changes in Mk number based on ploidy analysis after intravenous Thpo injection in Clec2MkΔ/Δ (Δ/Δ) and Clec2Mk+/+ (+/+) mice. Controls were injected with PBS. (B) Change in percentage of BrdU-positive HSCs after intravenous Thpo injection in Δ/Δ and +/+ mice. (A and B) Means ± SD. n = 4 (B) or 5 (A); two independent experiments. **, P < 0.01 by Tukey’s test. (C) Representative flow cytometry plot of Pyronin Y and Hoechst 33342 for CD34-LSK cells from Δ/Δ and +/+ mice after administration of PBS or Thpo. Numbers indicate percentage of Pyronin Y–negative cells in CD34-LSK cells. Means ± SD. n = 4; two independent experiments. *, P < 0.05 by Student’s t test. (D and E) Total number (D) and frequency (E) of Pyronin Y–negative CD34-LSK cells. Means ± SD. n = 4; two independent experiments. **, P < 0.01 by Tukey’s test. Note that Pyronin Y–negative CD34-LSK cell number is restored in Clec2MkΔ/Δ (Δ/Δ) BM after Thpo injection. (F) IHC of BMs from Δ/Δ and +/+ mice after administration of PBS or Thpo. Bar, 100 µm. (G and H) Percentage of donor-derived cells in PB (G) and BM HSPCs (H) at the indicated intervals after BMT. Means ± SEM. n = 6; two independent experiments. *, P < 0.05; and **, P < 0.01 by Tukey’s test.

Similar articles

Cited by

References

    1. Acton S.E., Astarita J.L., Malhotra D., Lukacs-Kornek V., Franz B., Hess P.R., Jakus Z., Kuligowski M., Fletcher A.L., Elpek K.G., et al. . 2012. Podoplanin-rich stromal networks induce dendritic cell motility via activation of the C-type lectin receptor CLEC-2. Immunity. 37:276–289. 10.1016/j.immuni.2012.05.022 - DOI - PMC - PubMed
    1. Acton S.E., Farrugia A.J., Astarita J.L., Mourão-Sá D., Jenkins R.P., Nye E., Hooper S., van Blijswijk J., Rogers N.C., Snelgrove K.J., et al. . 2014. Dendritic cells control fibroblastic reticular network tension and lymph node expansion. Nature. 514:498–502. 10.1038/nature13814 - DOI - PMC - PubMed
    1. Arai F., and Suda T.. 2007. Maintenance of quiescent hematopoietic stem cells in the osteoblastic niche. Ann. N. Y. Acad. Sci. 1106:41–53. 10.1196/annals.1392.005 - DOI - PubMed
    1. Arai F., Hirao A., Ohmura M., Sato H., Matsuoka S., Takubo K., Ito K., Koh G.Y., and Suda T.. 2004. Tie2/angiopoietin-1 signaling regulates hematopoietic stem cell quiescence in the bone marrow niche. Cell. 118:149–161. 10.1016/j.cell.2004.07.004 - DOI - PubMed
    1. Bénézech C., Nayar S., Finney B.A., Withers D.R., Lowe K., Desanti G.E., Marriott C.L., Watson S.P., Caamaño J.H., Buckley C.D., and Barone F.. 2014. CLEC-2 is required for development and maintenance of lymph nodes. Blood. 123:3200–3207. 10.1182/blood-2013-03-489286 - DOI - PMC - PubMed

Publication types

MeSH terms