. 2015 Nov 10:5:16533.
doi: 10.1038/srep16533.

Near-infrared (NIR) up-conversion optogenetics

Affiliations

Near-infrared (NIR) up-conversion optogenetics

Shoko Hososhima et al. Sci Rep. .

Abstract

Non-invasive remote control technologies designed to manipulate neural functions have been long-awaited for the comprehensive and quantitative understanding of neuronal network in the brain as well as for the therapy of neurological disorders. Recently, it has become possible for the neuronal activity to be optically manipulated using biological photo-reactive molecules such as channelrhodopsin (ChR)-2. However, ChR2 and its relatives are mostly reactive to visible light, which does not effectively penetrate through biological tissues. In contrast, near-infrared (NIR) light (650-1450 nm) penetrates deep into the tissues because biological systems are almost transparent to light within this so-called 'imaging window'. Here we used lanthanide nanoparticles (LNPs), composed of rare-earth elements, as luminous bodies to activate ChRs since they absorb low-energy NIR light to emit high-energy visible light (up-conversion). Here, we created a new type of optogenetic system which consists of the donor LNPs and the acceptor ChRs. The NIR laser irradiation emitted visible light from LNPs, then induced the photo-reactive responses in the near-by cells that expressed ChRs. However, there remains room for large improvements in the energy efficiency of the LNP-ChR system.


Figures
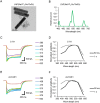
Figure 1
Figure 1. Donor-acceptor matching between LNP(NaYF4:Sc/Yb/Er) and ChRs.
(A) TEM images of LNP(NaYF4:Sc/Yb/Er). Scale, 200 nm. The rod-shaped materials were made of the hexagonal-phase crystals grown from the cubic phase crystals seen as smaller particles in the TEM image. These two species were inseparable. The relatively strong emission of LNP was mainly due to the hexagonal-phase crystals. (B) The relative emission spectrum. (C) Sample photocurrents of C1V1. Each photocurrent was measured from a ND7/23 cell expressing C1V1 in response to 1-s irradiation of light at 390, 438, 475, 513, 549, 575 or 632 nm. Each power of light was adjusted to 0.5 mW/mm2 on the specimen. (D) Spectral sensitivity of C1V1 photocurrent; charge during initial 50 ms (black) and 1 s (gray). (E) Sample photocurrents of mVChR1. Each photocurrent was measured from a ND7/23 cell expressing mVChR1 in response to 1-s irradiation of light at 390, 438, 475, 513, 549, 575 or 632 nm. Each power of light was adjusted to 0.5 mW/mm2 on the specimen. (F) Spectral sensitivity of mVChR1 photocurrent; charge during initial 50 ms (black) and 1 s (gray).
Figure 2
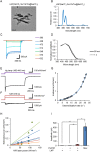
Figure 2. Near-infrared (NIR) up-conversion activation of C1V1.
(A) Experimental setup. The NIR laser light (975 nm) was irradiated from a fiber (diameter, 50 μm) in the patch electrode at a distance of 5.0 mm from the tip. (B) Two methods to apply LNPs to the specimens. Method 1: cells were cultured on a mixture of collagen and LNP on a coverslip. Method 2: the LNP-coated coverslip was put underneath the specimens upside down in the recording chamber. (C) A sample photocurrent of C1V1 evoked by filtered Hg lamp (530–550 nm, 14 mW/mm2) at a holding potential of −60 mV (ND7/23 cells). (D) In the same cell, photocurrents were also evoked by the NIR laser light (975 nm, 58 and 94 W/mm2). (E) Rate of rise of C1V1 photocurrent as a function of irradiance at 549 nm. Each symbol is a mean ± SEM (n = 5). The red line is drawn by the least squares fitting to the experimental responses to light less than 1 mW/mm2: y = 420x + 8.8 or x = 0.0024y − 0.021. (F) The relationship between the estimated power of green light emission and the NIR laser power in the case of Method 1. Each symbol represents individual ND7/23 cell. The slope of linear approximation gives the energy efficiency. (G) Similar to F, but in the case of Method 2. Note that the scale of ordinate is different.
Figure 3
Figure 3. Direct effects of NIR light.
(A) Top, the NIR laser at 41, 58 and 94 W/mm2. Middle, sample current responses of an ND7/23 cell without C1V1 but with LNPs (Method 1). Bottom, sample current responses of another ND7/23 cell expressing C1V1 with out LNPs. (B) Summary of current responses to the NIR laser light (975 nm, 58 W/mm2). From left to right, column 1: C1V1-null cells with LNPs (n = 7), column 2: C1V1-expressing cells without LNPs (middle, n = 9) and column 3: C1V1-expressing cells with LNPs (right, n = 7). Column 4 shows the summary of current responses to filtered Hg lamp (530–550 nm, 14 mW/mm2, n = 7) for reference. The LNPs were applied using Method 1. *P < 0.05 and **P < 0.01 (Kruskal-Wallis test among column 1–3 and Wilcoxon signed-ranks test between column 3 and 4).
Figure 4
Figure 4. NIR up-conversion activation of PsChR.
(A) TEM images of LNP(NaYF4:Sc/Yb/Tm@NaYF4). Scale, 500 nm. (B) The relative emission spectrum. (C) Sample photocurrents of PsChR evoked by 1-s irradiation of light at 390, 438, 475, 513, 549, 575 and 632 nm (ND7/23 cells). Each power of light was adjusted to 0.5 mW/mm2 on the specimen. (D) Spectral sensitivity of PsChR photocurrent; charge during initial 50 ms (black) and 1 s (gray). (E) A sample photocurrent of PsChR evoked by filtered Hg lamp (400–440 nm, 37 mW/mm2) at a holding potential of −60 mV (ND7/23 cells). (F) In the same cell, photocurrents were also evoked by the NIR laser light (975 nm, 58 and 94 W/mm2, respectively). (G) The relationship between desensitization rate of PsChR photocurrent and the irradiance at 438 nm. Note that the ordinate is the irradiance and the abscissa is the desensitization rate. Each symbol is mean ± SEM (n = 6). The blue line is drawn by the least squares fitting of the experimental data to a polynomial function: y = 0.0000040x4 − 0.00011x3 + 0.0021x2 + 0.011x − 0.013. (H) The relationship between the estimated power of blue light emission and the NIR laser power (Method 1). Each symbol represents individual ND7/23 cell. The slope of linear approximation gives the energy efficiency. (I) Summary of current responses to the NIR laser light (975 nm, 58 W/mm2). From left to right, column 1: PsChR-null cells with LNPs (n = 6), column 2: PsChR-expressing cells without LNPs (middle, n = 5) and column 3: PsChR-expressing cells with LNPs (right, n = 7). Column 4 shows the summary of the current responses to filtered Hg lamp (400–440 nm, 37 mW/mm2, n = 7) for reference. The LNPs were applied using Method 1. *P < 0.05 and **P < 0.01 (Kruskal-Wallis test among column 1–3 and Wilcoxon signed-ranks test between column 3 and 4).
Figure 5
Figure 5. Neuronal activation by up-conversion.
(A) Sample responses of a C1V1-expressing neuron; left, to the filtered Hg lamp (530–550 nm, 14 mW/mm2) and right, to the NIR laser (41 W/mm2) with LNP(NaYF4:Sc/Yb/Er) using Method 2. (B) Similar to A, but from an mVChR1-expressing neuron. (C) Sample responses of the same neuron shown in A to 50 ms NIR pulses (975 nm, 41 W/mm2) at 10 Hz (left) and 2 Hz (right). (D) Sample responses of the same neuron shown in B to 50 ms NIR pulses (975 nm, 41 W/mm2) at 10 Hz (left) and 2 Hz (right). *surplus action potentials.

References

    1. Nagel G. et al. Channelrhodopsin-2, a directly light-gated cation-selective membrane channel. Proc. Natl. Acad. Sci. USA 100, 13940–13945 (2003). - PMC - PubMed
    1. Boyden E.S., Zhang F., Bamberg E., Nagel G. & Deisseroth K. Millisecond-timescale, genetically targeted optical control of neural activity. Nat. Neurosci. 8, 1263–1268 (2005). - PubMed
    1. Ishizuka T., Kakuda M., Araki R. & Yawo H. Kinetic evaluation of photosensitivity in genetically engineered neurons expressing green algae light-gated channels. Neurosci. Res. 54, 85–94 (2006). - PubMed
    1. Han X. & Boyden E. S. Multiple-color optical activation, silencing, and desynchronization of neural activity, with single-spike temporal resosution. PLoS ONE 2, e299 (2007). - PMC - PubMed
    1. Zhang F. et al. Multimodal fast optical interrogation of neural circuitry. Nature 446, 633–639 (2007). - PubMed

Publication types

Substances