. 2015 Nov 9:15:273.
doi: 10.1186/s12870-015-0658-3.

In vivo quantitative imaging of photoassimilate transport dynamics and allocation in large plants using a commercial positron emission tomography (PET) scanner

Affiliations

In vivo quantitative imaging of photoassimilate transport dynamics and allocation in large plants using a commercial positron emission tomography (PET) scanner

Abhijit A Karve et al. BMC Plant Biol. .

Abstract

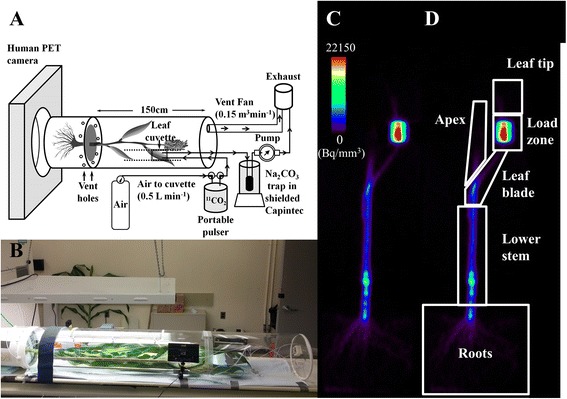
Background: Although important aspects of whole-plant carbon allocation in crop plants (e.g., to grain) occur late in development when the plants are large, techniques to study carbon transport and allocation processes have not been adapted for large plants. Positron emission tomography (PET), developed for dynamic imaging in medicine, has been applied in plant studies to measure the transport and allocation patterns of carbohydrates, nutrients, and phytohormones labeled with positron-emitting radioisotopes. However, the cost of PET and its limitation to smaller plants has restricted its use in plant biology. Here we describe the adaptation and optimization of a commercial clinical PET scanner to measure transport dynamics and allocation patterns of (11)C-photoassimilates in large crops.

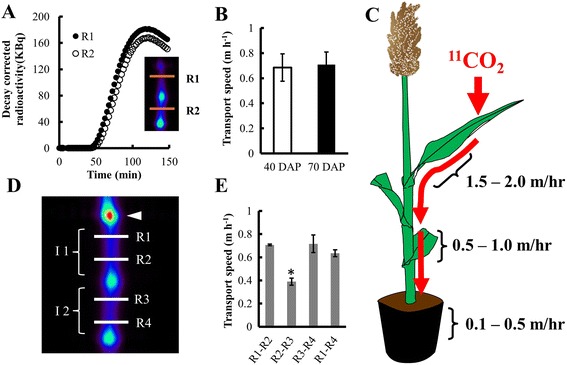
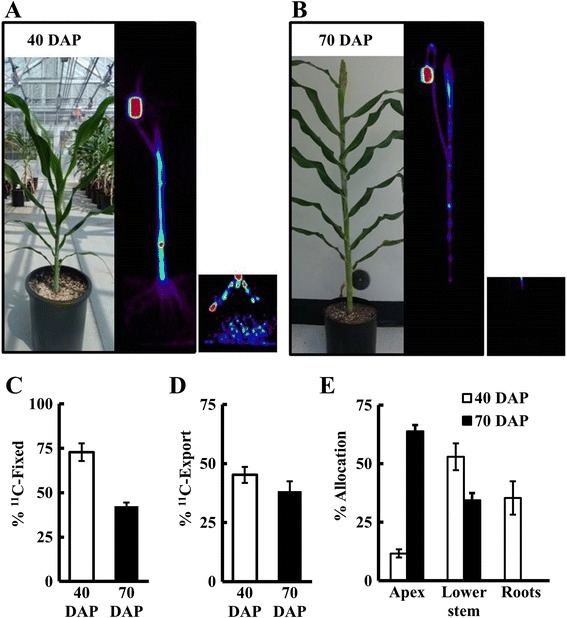
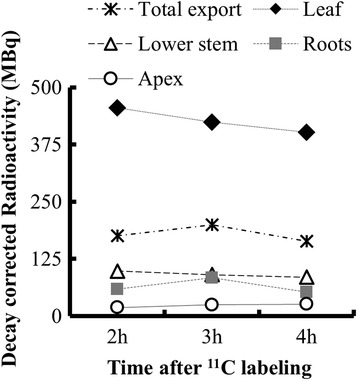
Results: Based on measurements of a phantom, we optimized instrument settings, including use of 3-D mode and attenuation correction to maximize the accuracy of measurements. To demonstrate the utility of PET, we measured (11)C-photoassimilate transport and allocation in Sorghum bicolor, an important staple crop, at vegetative and reproductive stages (40 and 70 days after planting; DAP). The (11)C-photoassimilate transport speed did not change over the two developmental stages. However, within a stem, transport speeds were reduced across nodes, likely due to higher (11)C-photoassimilate unloading in the nodes. Photosynthesis in leaves and the amount of (11)C that was exported to the rest of the plant decreased as plants matured. In young plants, exported (11)C was allocated mostly (88 %) to the roots and stem, but in flowering plants (70 DAP) the majority of the exported (11)C (64 %) was allocated to the apex.

Conclusions: Our results show that commercial PET scanners can be used reliably to measure whole-plant C-allocation in large plants nondestructively including, importantly, allocation to roots in soil. This capability revealed extreme changes in carbon allocation in sorghum plants, as they advanced to maturity. Further, our results suggest that nodes may be important control points for photoassimilate distribution in crops of the family Poaceae. Quantifying real-time carbon allocation and photoassimilate transport dynamics, as demonstrated here, will be important for functional genomic studies to unravel the mechanisms controlling phloem transport in large crop plants, which will provide crucial insights for improving yields.


Figures

Fig. 1
Fig. 1
Experimental set up of sorghum for PET imaging using a commercial clinical PET scanner. a Schematic of the 11CO2 administration and imaging system developed for large grasses. b Side view of a 70 day-old- plant used in one of the experiments, the black rectangular box in the picture is the LED light panel used to ensure consistent illumination of the leaf cuvette. c A reconstructed PET image of 11C distribution in 70 day-old- sorghum-plant. d PET image shown in c with ROIs drawn to measure 11C-allocation to different tissues
Fig. 2
Fig. 2
Optimization of PET parameters using 18F plant phantoms. a Effect of scatter on the accuracy of stem and root phantom radioactivity measurements. Bars show percent reduction in the error of phantom measurement after scatter correction under 3-D mode. b Effect of attenuation on the accuracy of stem and root phantom radioactivity measurements. Bars show percent reduction in the error of phantom measurement after attenuation correction under either 2-D (white) or 3-D (Grey) mode. c & d Error in the stem c and root d phantom radioactivity measurements based on the emission scans under 2-D and 3-D mode with different transmission scan times (10 s, 2 min, 4 min, and 20 min). For (C) and (D), bars show the average error of PET measurements of 18F phantom radioactivity, after attenuation correction and scatter correction, as a percent of the radioactivity of the phantoms measured using a calibrated scintillation counter. For all graphs error bars represent standard error
Fig. 3
Fig. 3
Use of PET to measure the dynamics in photoassimilate transport. a Changes in decay corrected radioactivity over time of 11C at two ROIs (R1 and R2) shown in the insert. Each curve represents changes in radioactivity over time in that ROI. The high radioactivity (i.e., bright green) spots in the insert are nodes. b Transport speed of the 11C-photoassimilate between R1 and R2 measured at 40 and 70 DAP in sorghum, bars are mean ± SE of at least 3 replicate plants. c 11C-photoassimilate transport speeds measured in leaf blades, stems, and individual roots. d Reconstructed image of the scanned sorghum stem in the FOV of the PET scanner with the individual ROIs (R1, R2, R3 and R4) outlined to estimate the changes in transport within an internode or across a node. White arrowhead shows the point of attachment of the target leaf; I1 and I2 are the two internodes in the FOV. e Transport speeds between different ROIs, calculated from TOAs using a combination of two of the ROIs, shown in (d)
Fig. 4
Fig. 4
Use of PET to analyze C-allocation in sorghum at two developmental stages. Two hours after the administration of a 1 min pulse of 11CO2 to the youngest fully expanded leaf of a sorghum plant, excluding the flag leaf, the entire plant was scanned in 15 cm segments. Representative PET images of sorghum plants at, a vegetative stage (40 DAP) and b early flowering stage (70 DAP), showing distribution of 11C. Insets show roots with higher contrast for visualization, with contrast set the same level in A and B. c Percent fixation determined based on the total 11C administered minus the 11C radioactivity not fixed, measured in a soda lime trap placed inside a Capintec Dose Calibrator at 2 min after pulsing. d Percent export from the target leaf, and e percent allocation of exported 11C to roots, lower stem, and apex. The data represent the mean ± SE of 3 independent plants
Fig. 5
Fig. 5
11C allocation at different times after 11CO2 administration. Quantification of 11C-allocation from three emission scans performed 2 h, 3 h, and 4 h after 11CO2 administration to the leaf of a 70 DAP sorghum plant. Each data point represents decay-corrected 11C-radioactivity (MBq) measured in that ROI, except for total export which represents total radioactivity exported from the leaf for each scan

References

    1. Tilman D, Balzer C, Hill J, Befort BL. Global food demand and the sustainable intensification of agriculture. Proc Natl Acad Sci. 2011;108(50):20260–20264. doi: 10.1073/pnas.1116437108. - DOI - PMC - PubMed
    1. Foley JA, Ramankutty N, Brauman KA, Cassidy ES, Gerber JS, Johnston M, et al. Solutions for a cultivated planet. Nature. 2011;478(7369):337–342. doi: 10.1038/nature10452. - DOI - PubMed
    1. Evans JR. Improving photosynthesis. Plant Physiol. 2013;162(4):1780–1793. doi: 10.1104/pp.113.219006. - DOI - PMC - PubMed
    1. Kalt-Torres W, Huber SC. Diurnal changes in maize leaf photosynthesis III. Leaf elongation rate in relation to carbohydrates and activities of sucrose metabolizing enzymes in elongating leaf tissue. Plant Physiol. 1987;83(2):294–298. doi: 10.1104/pp.83.2.294. - DOI - PMC - PubMed
    1. Kaschuk G, Hungria M, Leffelaar P, Giller K, Kuyper T. Differences in photosynthetic behaviour and leaf senescence of soybean (Glycine max [L.] Merrill) dependent on N2 fixation or nitrate supply. Plant Biol. 2010;12(1):60–69. doi: 10.1111/j.1438-8677.2009.00211.x. - DOI - PubMed

Publication types

LinkOut - more resources