. 2015 Nov 10:5:16230.
doi: 10.1038/srep16230.

Interval analysis of interictal EEG: pathology of the alpha rhythm in focal epilepsy

Affiliations

Interval analysis of interictal EEG: pathology of the alpha rhythm in focal epilepsy

Jan Pyrzowski et al. Sci Rep. .

Abstract

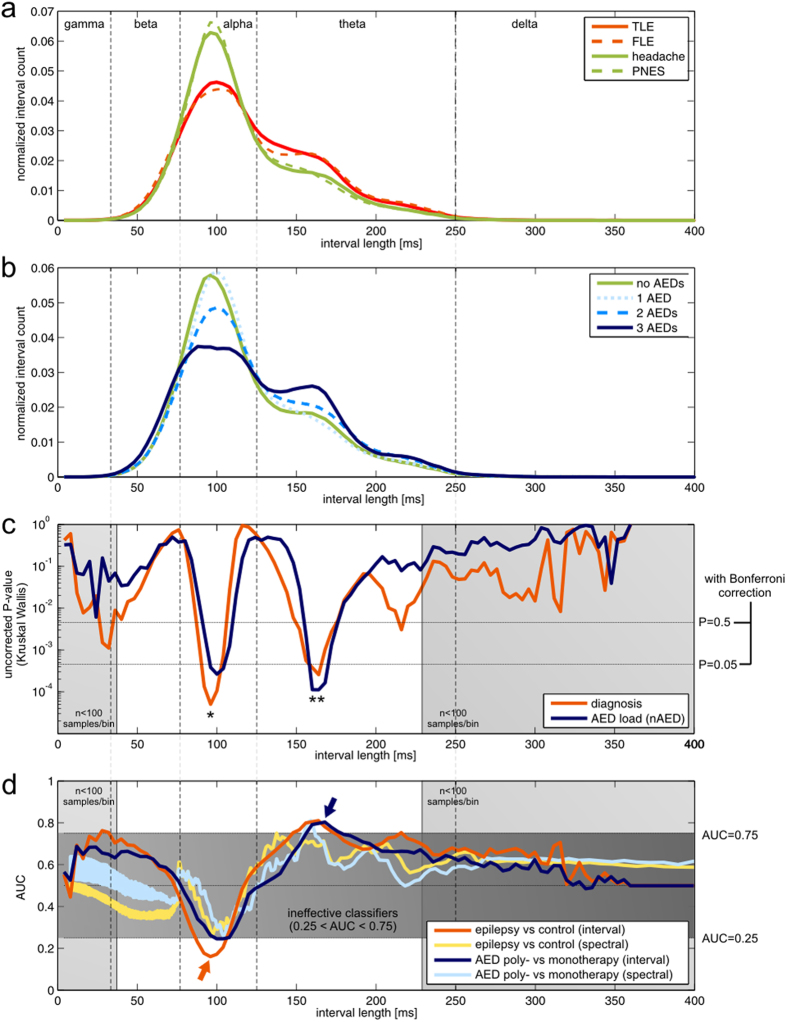
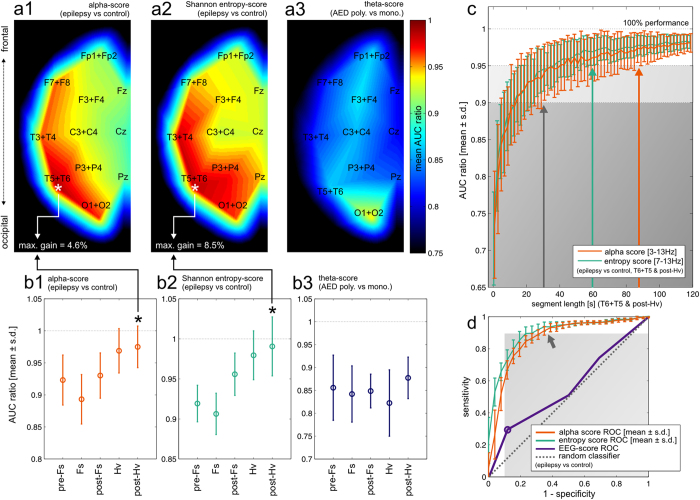
The contemporary use of interictal scalp electroencephalography (EEG) in the context of focal epilepsy workup relies on the visual identification of interictal epileptiform discharges. The high-specificity performance of this marker comes, however, at a cost of only moderate sensitivity. Zero-crossing interval analysis is an alternative to Fourier analysis for the assessment of the rhythmic component of EEG signals. We applied this method to standard EEG recordings of 78 patients divided into 4 subgroups: temporal lobe epilepsy (TLE), frontal lobe epilepsy (FLE), psychogenic nonepileptic seizures (PNES) and nonepileptic patients with headache. Interval-analysis based markers were capable of effectively discriminating patients with epilepsy from those in control subgroups (AUC~0.8) with diagnostic sensitivity potentially exceeding that of visual analysis. The identified putative epilepsy-specific markers were sensitive to the properties of the alpha rhythm and displayed weak or non-significant dependences on the number of antiepileptic drugs (AEDs) taken by the patients. Significant AED-related effects were concentrated in the theta interval range and an associated marker allowed for identification of patients on AED polytherapy (AUC~0.9). Interval analysis may thus, in perspective, increase the diagnostic yield of interictal scalp EEG. Our findings point to the possible existence of alpha rhythm abnormalities in patients with epilepsy.


Figures

Figure 1
Figure 1. Statistical analysis of zero-crossing interval spectra (whole recordings).
The vertical lines demark interval length ranges corresponding to commonly used electroencephalographic frequency bands. Note that increased counts of intervals of a certain length do not necessarily correspond to a sinusoidal rhythm and so, even though oscillation frequency and period are inversely related, Fourier spectral bands cannot be viewed as a simple equivalent of corresponding interval ranges (e.g. the 8–13 Hz alpha band and the respective 77–125 ms alpha range). (a) Averaged interval spectra for different diagnosis subgroups. The peak in the alpha interval range is visibly lower in epilepsy subgroups (red lines) than in control patient subgroups (green lines). Increased contribution of theta intervals to the spectrum is also seen in patients with epilepsy. (b) Averaged interval spectra for subgroups with different nAED. Changes qualitatively similar as described above are associated with increasing number of AEDs taken by the patients (blue lines). (c) Statistical analysis performed for fixed interval lengths: P-value vs interval length relationships for the effects of diagnosis (red line) and of nAED (dark blue line). Horizontal lines represent Bonferroni-corrected P value levels. The significant diagnosis effect dominates in the alpha-range (single asterisk) while the theta-range contains comparable overlapping significant effects of both independent variables (double asterisk, the nAED effect is more significant). Light grey areas represent interval ranges that were rejected form analysis (see Methods) (d) “Naive” ROC analysis performed for fixed interval lengths. AUC vs interval length relationships are shown for epilepsy vs control and AED polytherapy vs monotherapy classification problems (see also Suppl. Fig. 2). The dark-grey area represents no potentially effective classification (0.25 < AUC < 0.75). For interval spectrum based classifiers (red and dark blue lines) arrows mark the curves’ extremal points which correspond to potentially useful markers. AUC-inverse frequency relationships obtained for a Fourier power spectrum based classifiers (yellow and light blue lines) are shown for comparison. Trends for the decrease in alpha and increase in theta are consistent across both methods.
Figure 2
Figure 2. Trends in the optimization of alpha-, Shannon entropy- and theta-score based classifiers.
Note that AUC values and ROC curves displayed in this figure serve only to illustrate trends in the process of optimisation instead of being results of cross-validation (which are summarized in Table 2). The results are displayed as AUC ratios (see Results). (a1–a3) The distributions of mean AUC ratios over EEG channel positions. It can be seen that alpha- and Shannon entropy-scores perform best for temporal-occipital leads (white asterisks) while the theta-score performance is uniformly reduced across individual channels with the exception of O2 + O1. (b1–b3) The dependence of mean AUC ratios on the recording segments. For alpha- and Shannon entropy-scores performance increases towards the end of the recording with a maximum in the post-Hv segment (black asterisks). (c) The expected dependence of performance (alpha- and Shannon entropy-scores) on segment length (T6 + T5 & post-Hv, 1–120 s). 100% performance refers to “naive” AUC obtained for the full-length segment. Grey shaded areas correspond to 90% and 95% performance and arrows indicate the minimum segment lengths for which respective performance levels are reached (see Results for details). (d) Averaged ROC curves (see Results for details) for alpha- and Shannon entropy-scores (red and green curves respectively). The ROC curve associated with the EEG-score is shown for comparison (violet curve, the circle represents classification based on the presence of IEDs). The grey shaded area corresponds to sensitivity or specificity <90%. Interval spectrum-based markers achieve >90% sensitivity for ~60–70% specificity (arrow).

References

    1. Noachtar S. & Rémi J. The role of EEG in epilepsy: a critical review. Epilepsy Behav. 15, 22–33 (2009). - PubMed
    1. Bodde N. M. G. et al. Psychogenic non-epileptic seizures—diagnostic issues: a critical review. Clin. Neurol. Neurosurg. 111, 1–9 (2009). - PubMed
    1. Stoller A. Slowing of the Alpha-Rhythm of the Electro-Encephalogram and its Association with Mental Deterioration and Epilepsy. Br. J. Psychiatry 95, 972–984 (1949). - PubMed
    1. Aich T. K. Absent posterior alpha rhythm: An indirect indicator of seizure disorder? Indian J. Psychiatry 56, 61–66 (2014). - PMC - PubMed
    1. Benbadis S. R. & Tatum W. O. Overintepretation of EEGs and misdiagnosis of epilepsy. J. Clin. Neurophysiol. Off. Publ. Am. Electroencephalogr. Soc. 20, 42–44 (2003). - PubMed

Publication types

MeSH terms