

The breakdown of superlubricity by driving-induced commensurate dislocations
- PMID: 26553308
- PMCID: PMC4639847
- DOI: 10.1038/srep16134
The breakdown of superlubricity by driving-induced commensurate dislocations
Abstract
In the framework of a Frenkel-Kontorova-like model, we address the robustness of the superlubricity phenomenon in an edge-driven system at large scales, highlighting the dynamical mechanisms leading to its failure due to the slider elasticity. The results of the numerical simulations perfectly match the length critical size derived from a parameter-free analytical model. By considering different driving and commensurability interface configurations, we explore the distinctive nature of the transition from superlubric to high-friction sliding states which occurs above the critical size, discovering the occurrence of previously undetected multiple dissipative jumps in the friction force as a function of the slider length. These driving-induced commensurate dislocations in the slider are then characterized in relation to their spatial localization and width, depending on the system parameters. Setting the ground to scale superlubricity up, this investigation provides a novel perspective on friction and nanomanipulation experiments and can serve as a theoretical basis for designing high-tech devices with specific superlow frictional features.
Figures
 while for the overdense one
  .
.
 .
.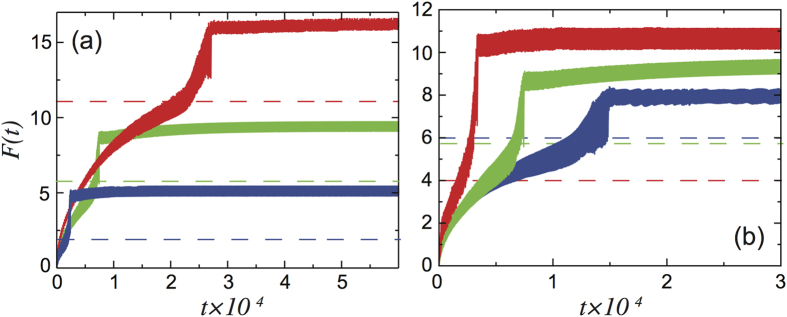
 from eq. (10) for different values of (a) K, (b) U0. The curves show numerical results for F(t) and the dashed lines are the theoretical values from eq. (10). (a) The red, green and blue curves are calculated for K = 20 N = 2000, K = 10 N = 2000 and K = 5 N = 360 respectively. (b) The red, green and blue curves correspond to U0 = 0.5 N = 450, U0 = 0.2 N = 1000 and U0 = 0.1 N = 1000 respectively.
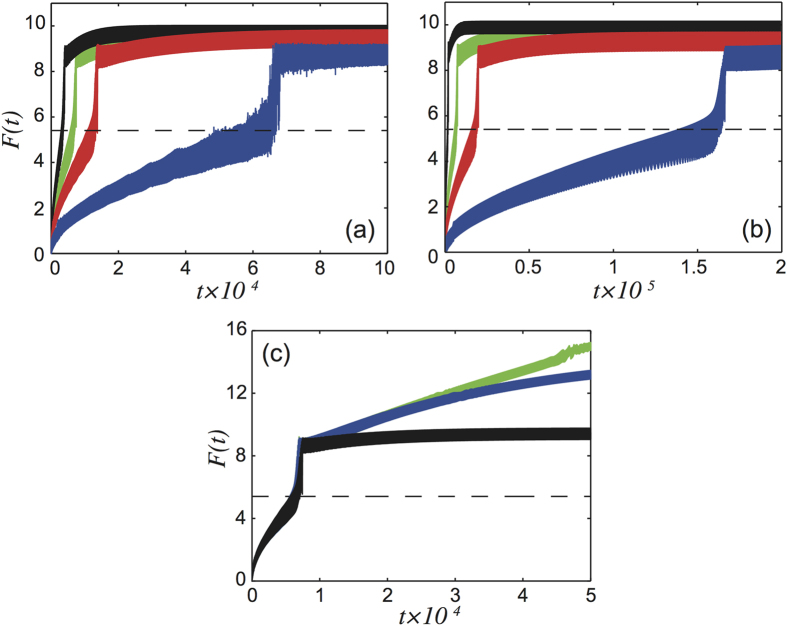
 from eq. (10) for different values of (a) η, (b) V0 and (c) N. The curves show numerical results for F(t) and the dashed lines are the theoretical values from eq. (10). (a) the black, green, red and blue curves are calculated for η = 0.2 N = 540, η = 0.1 N = 1000, η = 0.05 N = 2000 and η = 0.01 N = 9000 respectively. (b) The black, green, red and blue curves correspond to V0 = 0.1 N = 560, V0 = 0.05 N = 1000, V0 = 0.03 N = 1600 and V0 = 0.01 N = 4600 respectively. (c) The black, blue and green curves correspond to N = 1000, 2000 and 100000 respectively.
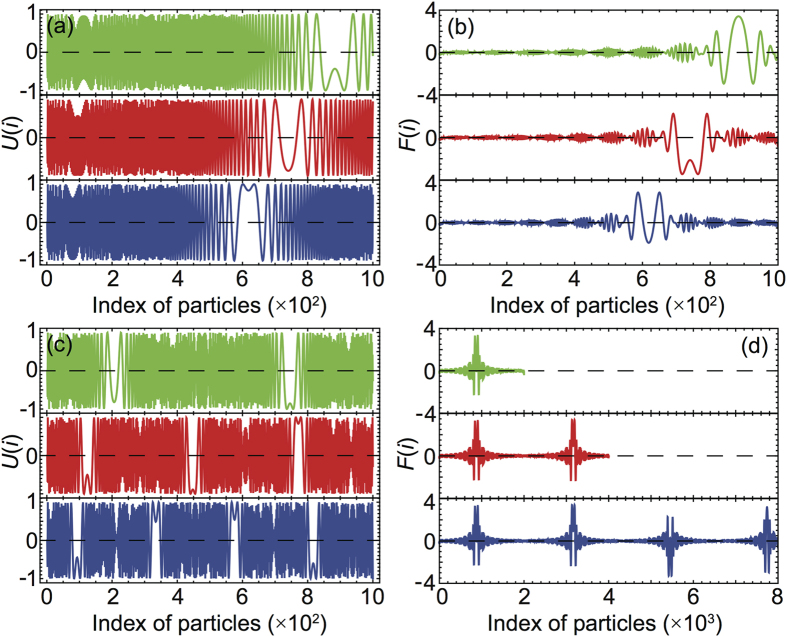
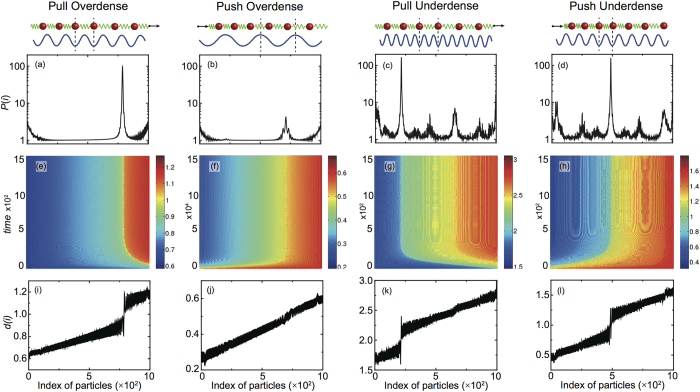
 . The three different plots correspond to δ = 3.0 × 10⁻³ (green), δ = 5.0 × 10⁻³ (red) and δ = 7.0 × 10⁻³ (blue). (d) Single particle force Fsub(i) for δ = 7.0 × 10⁻⁴ and different chain lengths. The three different plots correspond to N = 1000 (green), N = 4000 (red) and N = 8000 (blue).
References
-
- Vanossi A., Manini N., Urbakh M., Zapperi S. & Tosatti E. Modeling friction: From nanoscale to mesoscale. Rev. Mod. Phys. 85, 529 (2013).
-
- Müser M. H., Urbakh M. & Robbins M. O. Statistical mechanics of static and low-velocity kinetic friction. Adv. Chem. Phys. 126, 187 (2003).
-
- Braun O. M. & Kivshar Y. S. The Frenkel-Kontorova Model: Concepts, Methods, and Applications. Springer, Berlin (2004).
-
- Vanossi A. & Braun O. M. Driven dynamics of simplified tribological models. J. Phys. Condens. Matter 19, 305017 (2007).
-
- Erdemir A. & Martin J.-M. Superlubricity. Elsevier Science, New York (2007).
Publication types
LinkOut - more resources
Full Text Sources
Other Literature Sources
