. 2016 Jan;18(1):217-27.
doi: 10.1208/s12248-015-9841-6. Epub 2015 Nov 9.

Modeling Testosterone Circadian Rhythm in Hypogonadal Males: Effect of Age and Circannual Variations

Affiliations

Modeling Testosterone Circadian Rhythm in Hypogonadal Males: Effect of Age and Circannual Variations

Mario González-Sales et al. AAPS J. 2016 Jan.

Abstract

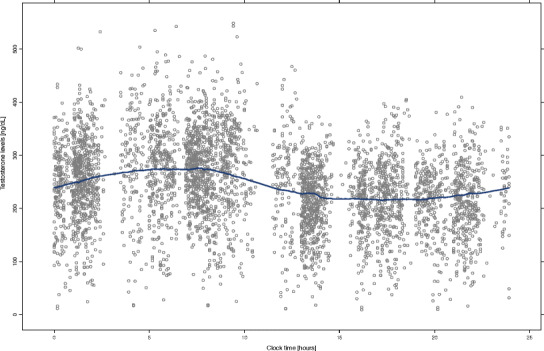
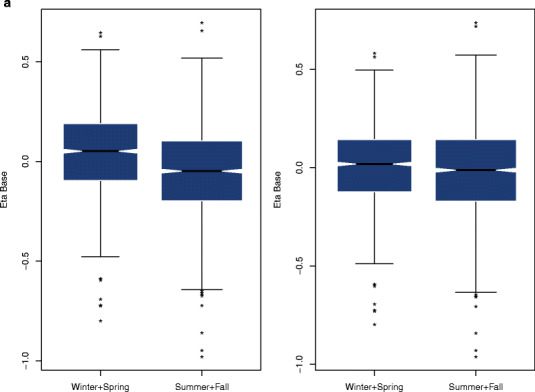
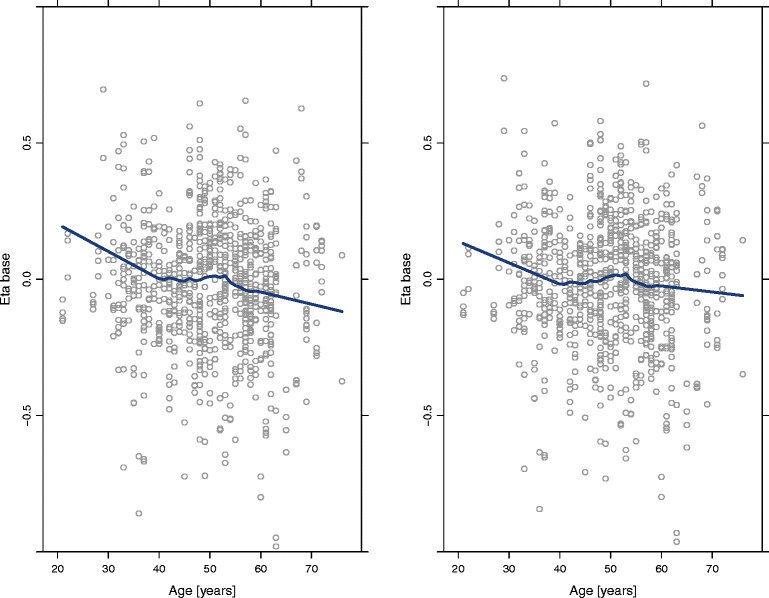
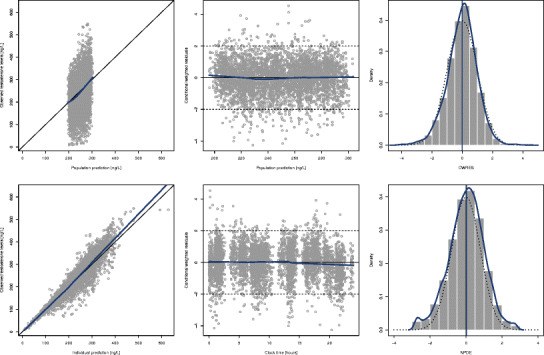
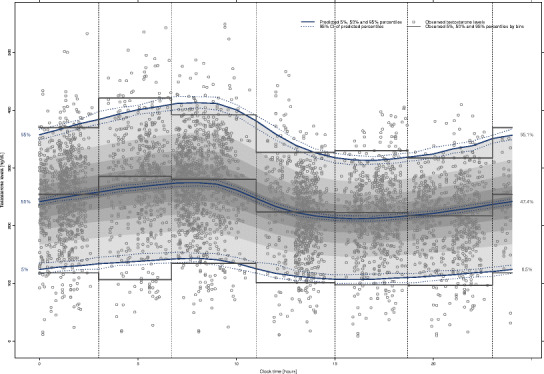
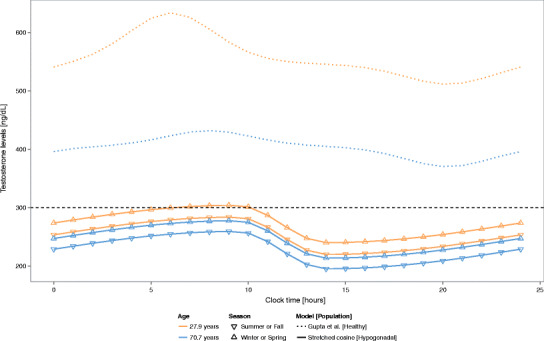
The objective of this study was to characterize the baseline circadian rhythm of testosterone levels in hypogonadal men. A total of 859 baseline profiles of testosterone from hypogonadal men were included in this analysis. The circadian rhythm of the testosterone was described by a stretched cosine function. Model parameters were estimated using NONMEM(®) 7.3. The effect of different covariates on the testosterone levels was investigated. Model evaluation was performed using non-parametric bootstrap and predictive checks. A stretched cosine function deeply improved the data goodness of fit compared to the standard trigonometric function (p < 0.001; ΔOFV = -204). The effect of the age and the semester, defined as winter and spring versus summer and fall, were significantly associated with the baseline levels of testosterone (p < 0.001, ΔOFV = -15.6, and p < 0.001, ΔOFV = -47.0). Model evaluation procedures such as diagnostic plots, visual predictive check, and non-parametric bootstrap evidenced that the proposed stretched cosine function was able to model the time course of the diurnal testosterone levels in hypogonadal males with accuracy and precision. The circadian rhythm of the testosterone levels was better predicted by the proposed stretched cosine function than a standard cosine function. Testosterone levels decreased by 5.74 ng/dL (2.4%) every 10 years and were 19.3 ng/dL (8.1%) higher during winter and spring compared to summer and fall.

Keywords: NONMEM®; circadian rhythm; stretched cosine function; testosterone.


Conflict of interest statement

The authors declare that they have no competing interests.

Figures

Fig. 1
Fig. 1
Time course of the baseline testosterone levels in hypogonadal men. Gray points represent observations. The blue line represents the smooth regression line
Fig. 2
Fig. 2
a Distribution of the interindividual variability (eta) of Base by season before (left panel) and after (right panel) including the effect of season in the model. Asterisks represent outliers. b Correlation between the interindividual variability (eta) of Base and age before (left panel) and after (right panel) including the effect of age in the model. The blue solid line represents the smooth regression line
Fig. 2
Fig. 2
a Distribution of the interindividual variability (eta) of Base by season before (left panel) and after (right panel) including the effect of season in the model. Asterisks represent outliers. b Correlation between the interindividual variability (eta) of Base and age before (left panel) and after (right panel) including the effect of age in the model. The blue solid line represents the smooth regression line
Fig. 3
Fig. 3
Diagnostic plots of the model developed to characterize testosterone kinetics in hypogonadal men. Left panels represent the scatterplots of observations and population predictions (upper panel, a) and the observations and individual predictions (lower panel, b). Middle panels show scatterplots of conditional weighted residuals and population predictions (upper panel, c) and time (lower panel, d). Right panels represent the density plots of conditional weighted residuals (upper panel, e) and normalized prediction distribution errors (lower panel, f). Blue lines represent the smooth regression line in scatterplots and the density line in density plots. Dotted black lines represent the theoretical density line
Fig. 4
Fig. 4
Visual predictive check of the model developed to characterize the time course of the testosterone levels in hypogonadal men. Blue lines represent the predicted 5th, 50th, and 95th percentiles of the testosterone concentrations. Dotted blue lines represent the 95% prediction interval (PI) of these percentiles. The shaded gray area represents the 90% prediction interval (PI) predicted for the model. Vertical dotted lines represent the selected bins. Gray solid lines represent the observed 5th, 50th, and 95th percentiles of testosterone concentrations in each bin. Figures at the margin of the plot represent the theoretical (left) and observed (right) percentage of observations below percentiles 5th, 50th, and 95th
Fig. 5
Fig. 5
Simulation of the time course of the testosterone levels based on typical patient values. The horizontal black dashed line represents the threshold for hypogonadism (300 ng/dL)

References

    1. Zarrouf FA, Artz S, Griffith J, et al. Testosterone and depression: systematic review and meta-analysis. J Psychiatr Pract. 2009;15:289–305. doi: 10.1097/01.pra.0000358315.88931.fc. - DOI - PubMed
    1. Bhasin S, Bremner WJ. Clinical review 85: emerging issues in androgen replacement therapy. J Clin Endocrinol Metab. 1997;82:3–8. - PubMed
    1. Andersena ML, Alvarenga TF, Mazaro-Costa R, et al. The association of testosterone, sleep, and sexual function in men and women. Brain Res. 2011;1416:80–104. doi: 10.1016/j.brainres.2011.07.060. - DOI - PubMed
    1. Vermeulen A, Kaufman JM. Diagnosis of hypogonadism in the aging male. Aging Male. 2002;5:170–6. doi: 10.1080/tam.5.3.170.176. - DOI - PubMed
    1. Bremner WJ, Vitiello MV, Prinz PN. Loss of circadian rhythmicity in blood testosterone levels with aging in normal men. J Clin Endocrinol Metab. 1983;56:1278–81. doi: 10.1210/jcem-56-6-1278. - DOI - PubMed

LinkOut - more resources