Review
. 2015 Nov;45 Suppl 1(Suppl 1):S51-60.
doi: 10.1007/s40279-015-0395-7.

Hypohydration and Human Performance: Impact of Environment and Physiological Mechanisms

Affiliations
Review

Hypohydration and Human Performance: Impact of Environment and Physiological Mechanisms

Michael N Sawka et al. Sports Med. 2015 Nov.

Abstract

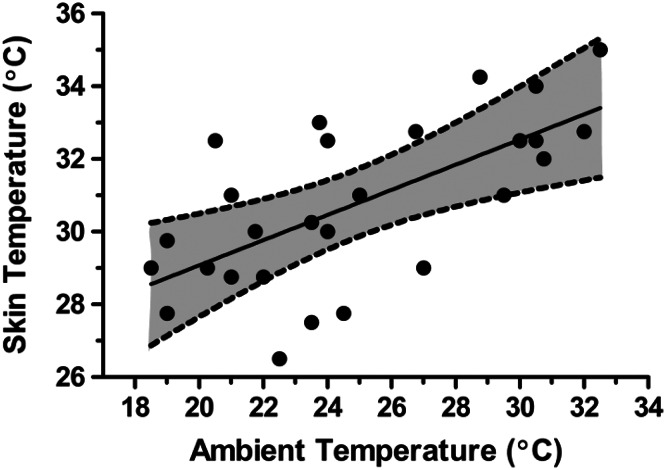
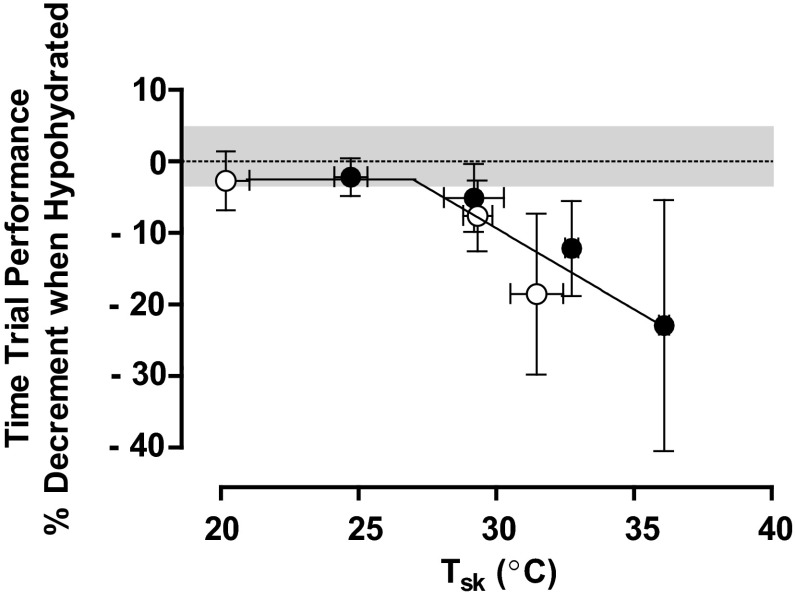
Body water losses of >2 % of body mass are defined as hypohydration and can occur from sweat loss and/or diuresis from both cold and altitude exposure. Hypohydration elicits intracellular and extracellular water loss proportionate to water and solute deficits. Iso-osmotic hypovolemia (from cold and high-altitude exposure) results in greater plasma loss for a given water deficit than hypertonic hypovolemia from sweat loss. Hypohydration does not impair submaximal intensity aerobic performance in cold-cool environments, sometimes impairs aerobic performance in temperate environments, and usually impairs aerobic performance in warm-hot environments. Hypohydration begins to impair aerobic performance when skin temperatures exceed 27 °C, and with each additional 1 °C elevation in skin temperature there is a further 1.5 % impairment. Hypohydration has an additive effect on impairing aerobic performance in warm-hot high-altitude environments. A commonality of absolute hypovolemia (from plasma volume loss) combined with relative hypovolemia (from tissue vasodilation) is present when aerobic performance is impaired. The decrement in aerobic exercise performance due to hypohydration is likely due to multiple physiological mechanisms, including cardiovascular strain acting as the 'lynchpin', elevated tissue temperatures, and metabolic changes which are all integrated through the CNS to reduce motor drive to skeletal muscles.


Figures

Fig. 1
Fig. 1
Approximation of hourly sweating rates (L/h) for runners at different running paces (m/min or min per mile) and environmental conditions (hot and humid, cool and dry). Redrawn with permission from Sawka [6]
Fig. 2
Fig. 2
Plot of average running speed and finish time for 42 km versus the magnitude of post-race hypohydration (dehydration, % body mass loss) level at finish when drinking ad libitum. Redrawn with permission from Cheuvront et al. [25]
Fig. 3
Fig. 3
Linear regression of plasma volume change (%∆ plasma volume) and hypohydration level (%∆ body mass) after induction of hypotonic (sweat) and isotonic (diuretic) body water losses. Redrawn with permission from Cheuvront et al. [37]
Fig. 4
Fig. 4
Relationship (regression line) between ambient (shaded dry bulb) temperature (°C) and skin temperature (°C) during aerobic exercise while wearing minimal clothing. The broken lines and grey shading represent 95 % confidence intervals. Figure was drawn from data in Adams [42]
Fig. 5
Fig. 5
Summary of a literature review of hypohydration level (percent change in body mass) effects on endurance (34 studies) and power (43 studies) performance. The y axis is the percentage of observations that demonstrated impaired performance (P < 0.05) with the appropriate fraction above each data bar. Redrawn with permission from Cheuvront and Kenefick [7]
Fig. 6
Fig. 6
Individual data for time-trial performance (kJ) when euhydrated (EUH) and hypohydrated (HYPO, 4 % body mass loss) in a 10 °C, b 20 °C, c 30 °C and d 40 °C environments. Adapted with permission from Kenefick et al. [50]
Fig. 7
Fig. 7
Percentage impairment in submaximal intensity aerobic performance (time-trial) from euhydration as a function of skin temperature (T sk) when hypohydrated by 3–4 % of body mass. Regression line indicates that at a T sk intercept of ~27 °C, the percentage decrement in aerobic exercise performance declines linearly by ~1.3 % for each 1 °C rise in T sk. The best-fit equation for the second linear line segment is y = −1.26x + 26.37. Data are means [error bars are 95 % confidence interval] for paired observations from three studies [–52]. Filled circles represent 15-min time-trial tests, open circles represent 30-min time-trial tests. Gray area represents the collective percent coefficient of variation of repeated practice time-trials (when euhydrated) in temperate conditions (~3.5 %). Adapted with permission from Sawka et al. [53]
Fig. 8
Fig. 8
Percent change in aerobic performance (time-trial) from euhydrated sea-level (SL-EUH) [zero reference] when euhydrated at high altitude (ALT-EUH), hypohydrated at sea level (SL-HYPO) or hypohydrated at high altitude (ALT-HYPO). Environmental temperature is 27 °C, high altitude is 3048 m, hypohydration is 4 % body mass loss and coefficient of variation (CV) is 3.1 %. Gray area represents collective percent coefficient of variation of repeated practice time-trials (when euhydrated). *P = 0.04, # P < 0.001. Data are mean and the error bars represent the 95 % confidence intervals. Adapted with permission from Castellani et al. [51]

References

    1. Sawka MN, Wenger CB, Pandolf KB. Thermoregulatory responses to acute exercise-heat stress and heat acclimation. In: Fregly MJ, Blatteis CM, editors. Handbook of physiology, section 4, environmental physiology. New York: Oxford University Press; 1996. pp. 157–185.
    1. Freund BJ, Young AJ. Environmental influences body fluid balance during exercise:cold exposure. In: Buskirk ER, Puhl SM, editors. Body fluid balance: exercise and sport. New York: CRC Press; 1996. pp. 159–181.
    1. Hoyt RW, Honig A. Body fluid and energy metabolism at high altitude. In: Am. Physiol. Soc., editor. Handbook of physiology: environmental physiology. Bethesda; 1996. p. 1277–89.
    1. Sawka MN. Body fluid responses and hypohydration during exercise-heat stress. In: Pandolf KB, Sawka MN, Gonzalez RR, editors. Human performance physiology and environmental medicine at terrestrial extremes. Indianapolis: Cooper Publishing Group; 1988. pp. 227–266.
    1. Mack GW, Nadel ER. Body fluid balance during heat stress in humans. In: Fregly MJ, Blatteis CM, editors. Handbook of physiology: environmental physiology. New York: Oxford University Press; 1996. pp. 187–214.