

Cardiac Disease Status Dictates Functional mRNA Targeting Profiles of Individual MicroRNAs
- PMID: 26553694
- PMCID: PMC4681654
- DOI: 10.1161/CIRCGENETICS.115.001237
Cardiac Disease Status Dictates Functional mRNA Targeting Profiles of Individual MicroRNAs
Abstract
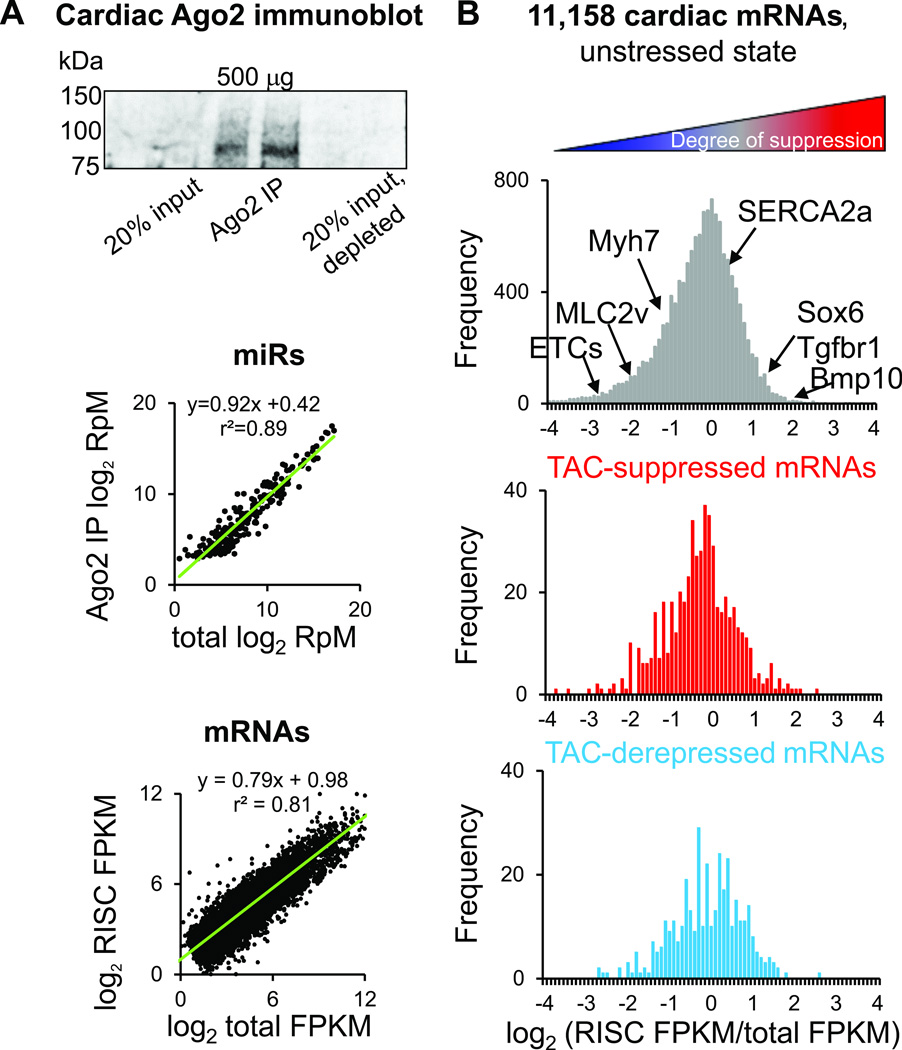
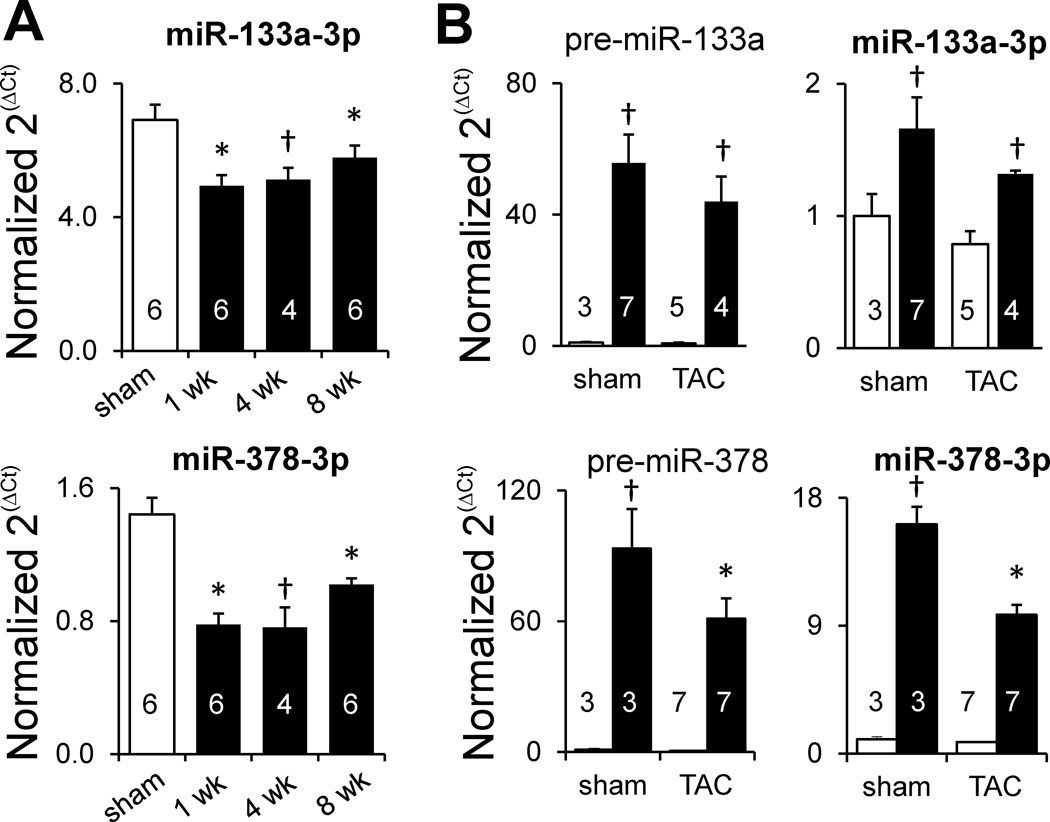
Background: MicroRNAs are key players in cardiac stress responses, but the mRNAs, whose abundance and translational potential are primarily affected by changes in cardiac microRNAs, are not well defined. Stimulus-induced, large-scale alterations in the cardiac transcriptome, together with consideration of the law of mass action, further suggest that the mRNAs most substantively targeted by individual microRNAs will vary between unstressed and stressed conditions. To test the hypothesis that microRNA target profiles differ in health and disease, we traced the fate of empirically determined miR-133a and miR-378 targets in mouse hearts undergoing pressure overload hypertrophy.
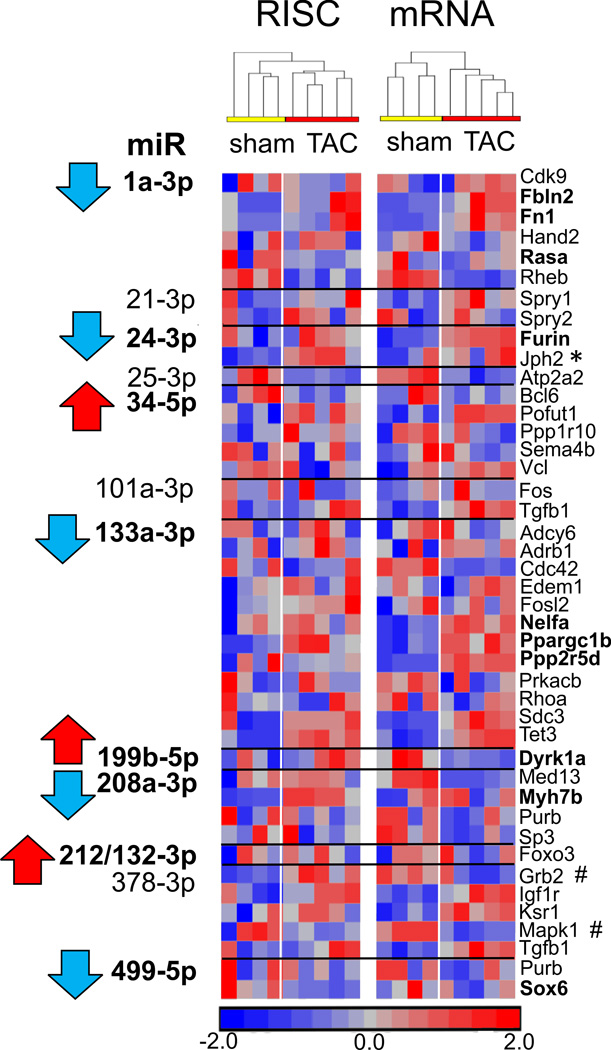
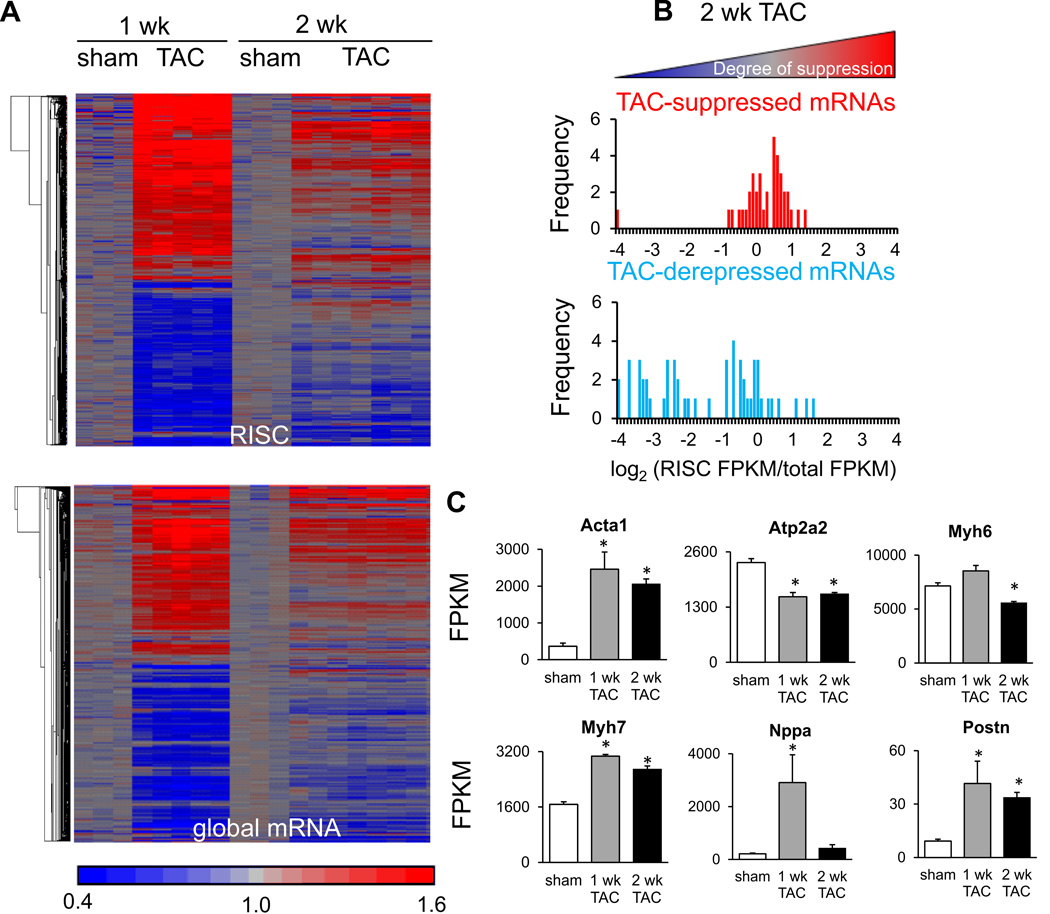
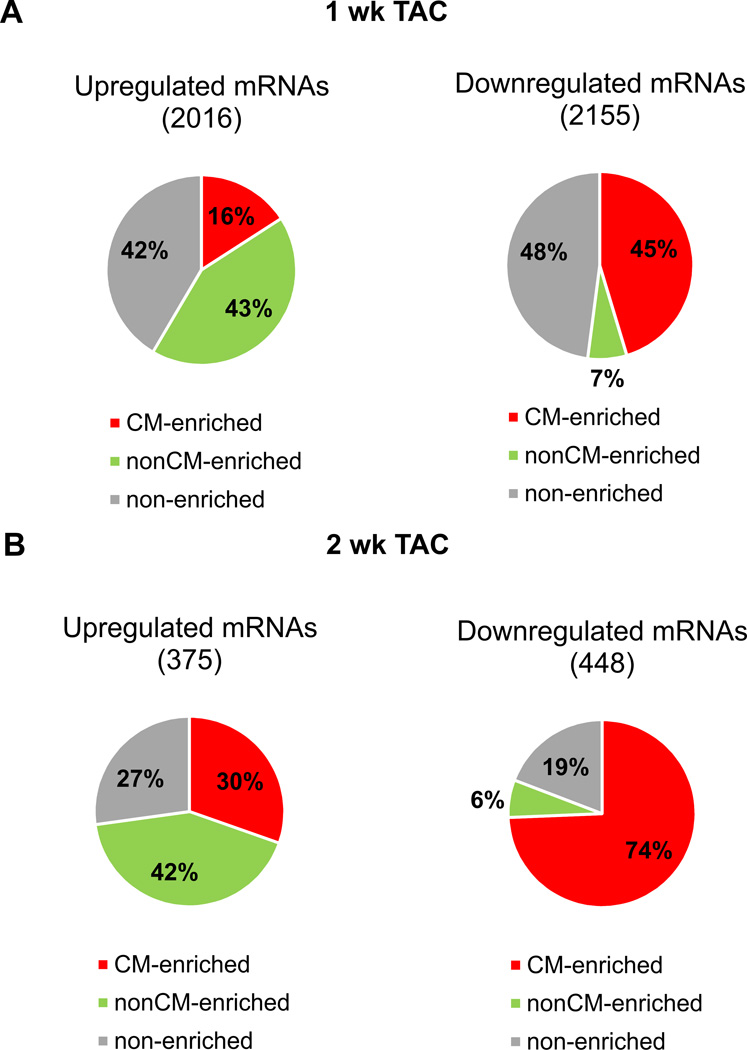
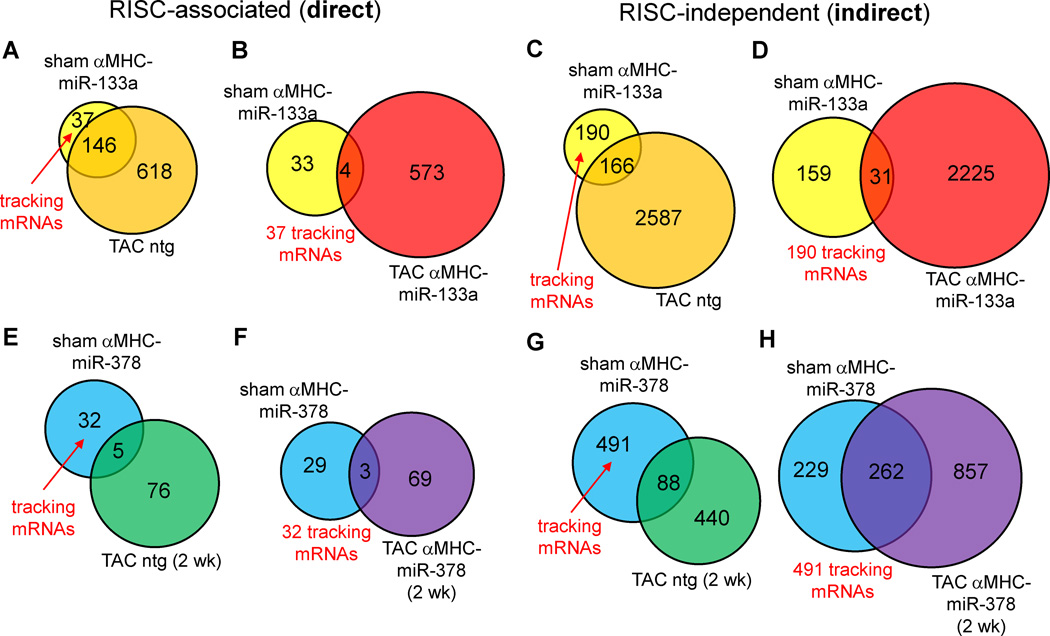
Methods and results: Ago2 immunoprecipitation with RNA sequencing (RNA-induced silencing complex sequencing) was used for unbiased definition of microRNA-dependent and microRNA-independent alterations occurring among ≈13 000 mRNAs in response to transverse aortic constriction (TAC). Of 37 direct targets of miR-133a defined in unstressed hearts (fold change ≥25%, false discovery rate <0.02), only 4 (11%) continued to be targeted by miR-133a during TAC, whereas for miR-378 direct targets, 3 of 32 targets (9%) were maintained during TAC. Similarly, only 16% (for miR-133a) and 53% (for miR-378) of hundreds of indirectly affected mRNAs underwent comparable regulation, demonstrating that the effect of TAC on microRNA direct target selection resulted in widespread alterations of signaling function. Numerous microRNA-mediated regulatory events occurring exclusively during pressure overload revealed signaling networks that may be responsive to the endogenous decreases in miR-133a during TAC.
Conclusions: Pressure overload-mediated changes in overall cardiac RNA content alter microRNA targeting profiles, reinforcing the need to define microRNA targets in tissue-, cell-, and status-specific contexts.
Keywords: Ago2 protein; RNA; RNA-induced silencing complex; gene expression; messenger; microRNAs; regulation.
© 2015 American Heart Association, Inc.
Conflict of interest statement
Figures
Similar articles
-
MicroRNA-133a protects against myocardial fibrosis and modulates electrical repolarization without affecting hypertrophy in pressure-overloaded adult hearts.Circ Res. 2010 Jan 8;106(1):166-75. doi: 10.1161/CIRCRESAHA.109.202176. Epub 2009 Nov 5. Circ Res. 2010. PMID: 19893015 Free PMC article.
-
HDACs Regulate miR-133a Expression in Pressure Overload-Induced Cardiac Fibrosis.Circ Heart Fail. 2015 Nov;8(6):1094-104. doi: 10.1161/CIRCHEARTFAILURE.114.001781. Epub 2015 Sep 14. Circ Heart Fail. 2015. PMID: 26371176 Free PMC article.
-
Exploring miRNA-mRNA regulatory network in cardiac pathology in Na+/H+ exchanger isoform 1 transgenic mice.Physiol Genomics. 2018 Oct 1;50(10):846-861. doi: 10.1152/physiolgenomics.00048.2018. Epub 2018 Jul 20. Physiol Genomics. 2018. PMID: 30029588 Free PMC article.
-
Therapeutic potential of microRNAs in heart failure.Curr Cardiol Rep. 2010 May;12(3):209-15. doi: 10.1007/s11886-010-0096-7. Curr Cardiol Rep. 2010. PMID: 20424963 Review.
-
MicroRNA regulation of cardiovascular development.Circ Res. 2009 Mar 27;104(6):724-32. doi: 10.1161/CIRCRESAHA.108.192872. Circ Res. 2009. PMID: 19325160 Free PMC article. Review.
Cited by
-
Metabolomic and transcriptomic signatures of chemogenetic heart failure.Am J Physiol Heart Circ Physiol. 2022 Mar 1;322(3):H451-H465. doi: 10.1152/ajpheart.00628.2021. Epub 2022 Jan 28. Am J Physiol Heart Circ Physiol. 2022. PMID: 35089810 Free PMC article.
-
Molecular mechanisms in vascular injury induced by hypertension: Expression and role of microRNA-34a.Exp Ther Med. 2017 Dec;14(6):5497-5502. doi: 10.3892/etm.2017.5216. Epub 2017 Sep 27. Exp Ther Med. 2017. PMID: 29285082 Free PMC article.
-
The Efficacy of Cardiac Anti-miR-208a Therapy Is Stress Dependent.Mol Ther. 2017 Mar 1;25(3):694-704. doi: 10.1016/j.ymthe.2017.01.012. Epub 2017 Feb 12. Mol Ther. 2017. PMID: 28202391 Free PMC article.
References
-
- Hausser J, Zavolan M. Identification and consequences of miRNA-target interactions--beyond repression of gene expression. Nat Rev Genet. 2014;15:599–612. - PubMed
-
- Huntzinger E, Izaurralde E. Gene silencing by microRNAs: contributions of translational repression and mRNA decay. Nat Rev Genet. 2011;12:99–110. - PubMed
-
- Long D, Lee R, Williams P, Chan CY, Ambros V, Ding Y. Potent effect of target structure on microRNA function. Nat Struct Mol Biol. 2007;14:287–294. - PubMed
-
- Khorshid M, Hausser J, Zavolan M, van Nimwegen E. A biophysical miRNA-mRNA interaction model infers canonical and noncanonical targets. Nat Methods. 2013;10:253–255. - PubMed
Publication types
MeSH terms
Substances
Grants and funding
LinkOut - more resources
Full Text Sources
Molecular Biology Databases
