. 2016 Jan 15;291(3):1162-74.
doi: 10.1074/jbc.M115.688457. Epub 2015 Nov 9.

Spectroscopic and Kinetic Properties of the Molybdenum-containing, NAD+-dependent Formate Dehydrogenase from Ralstonia eutropha

Affiliations

Spectroscopic and Kinetic Properties of the Molybdenum-containing, NAD+-dependent Formate Dehydrogenase from Ralstonia eutropha

Dimitri Niks et al. J Biol Chem. .

Abstract

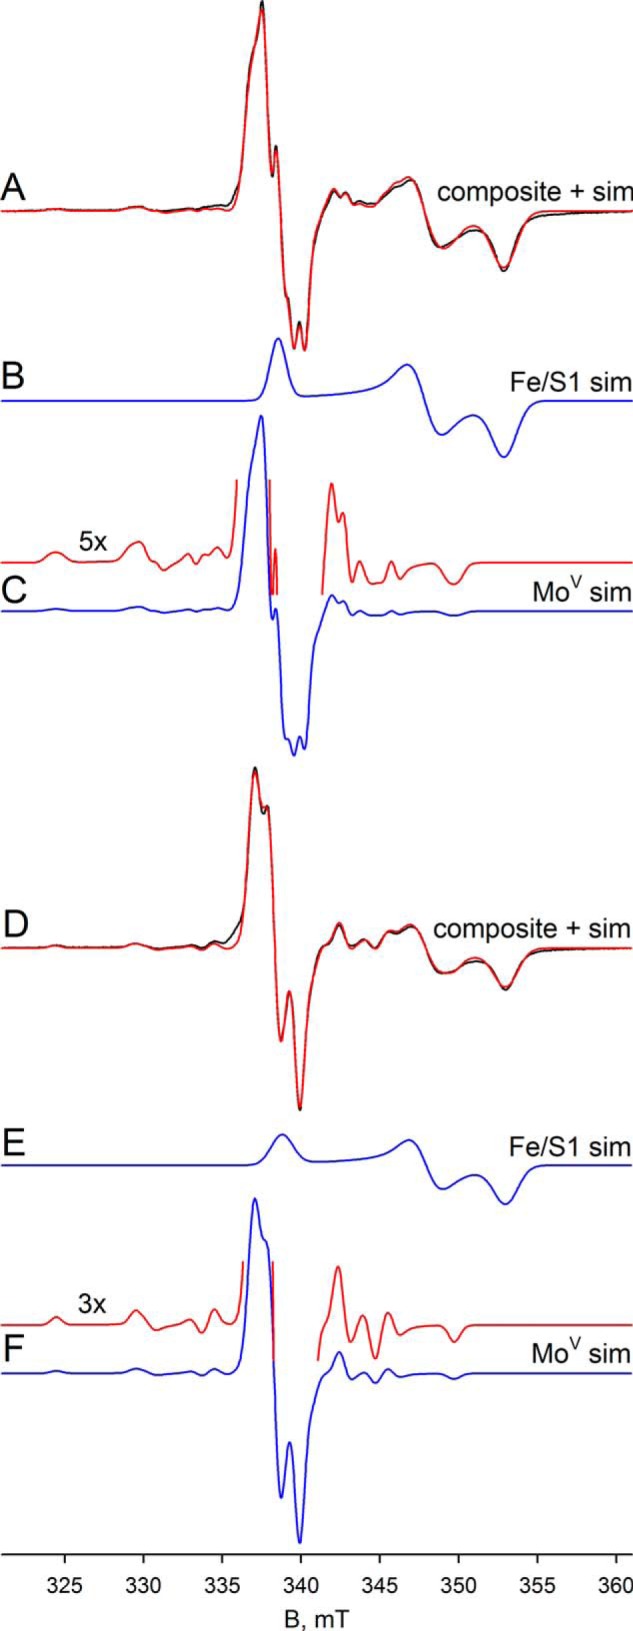
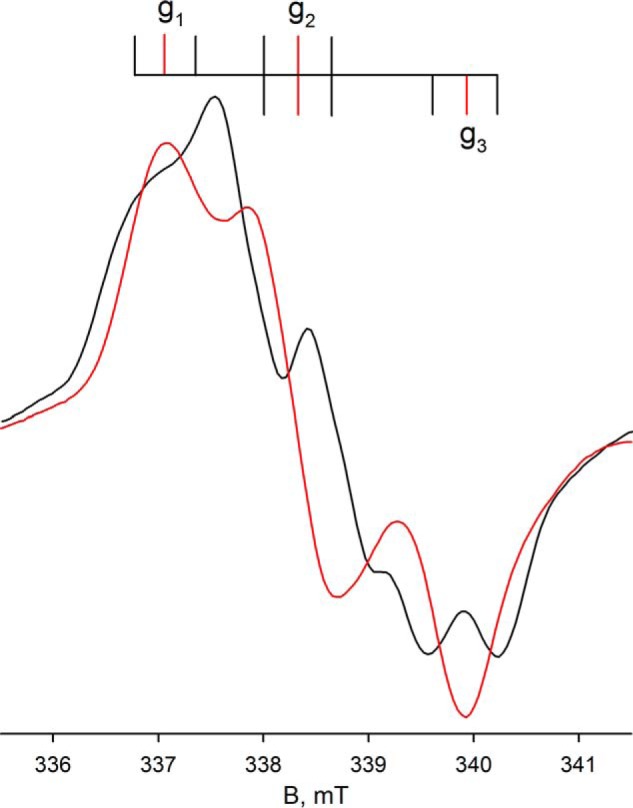
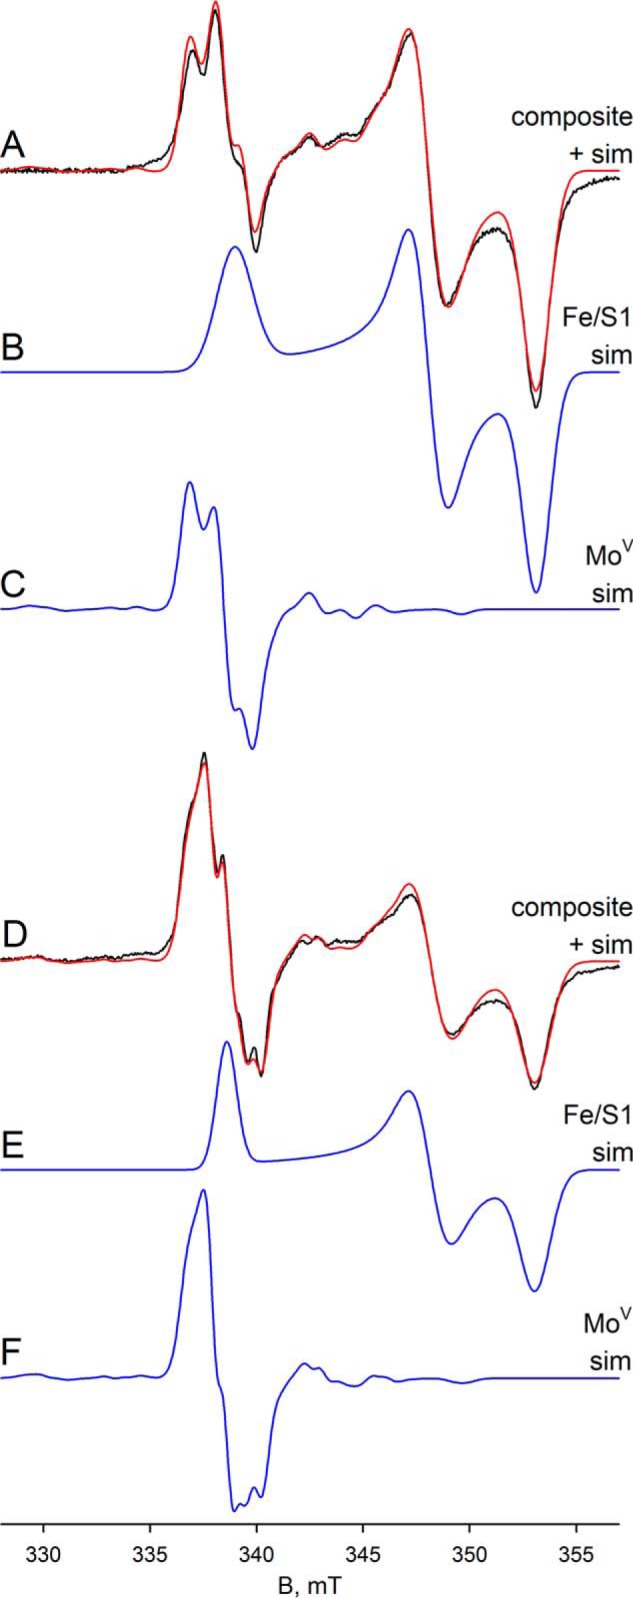
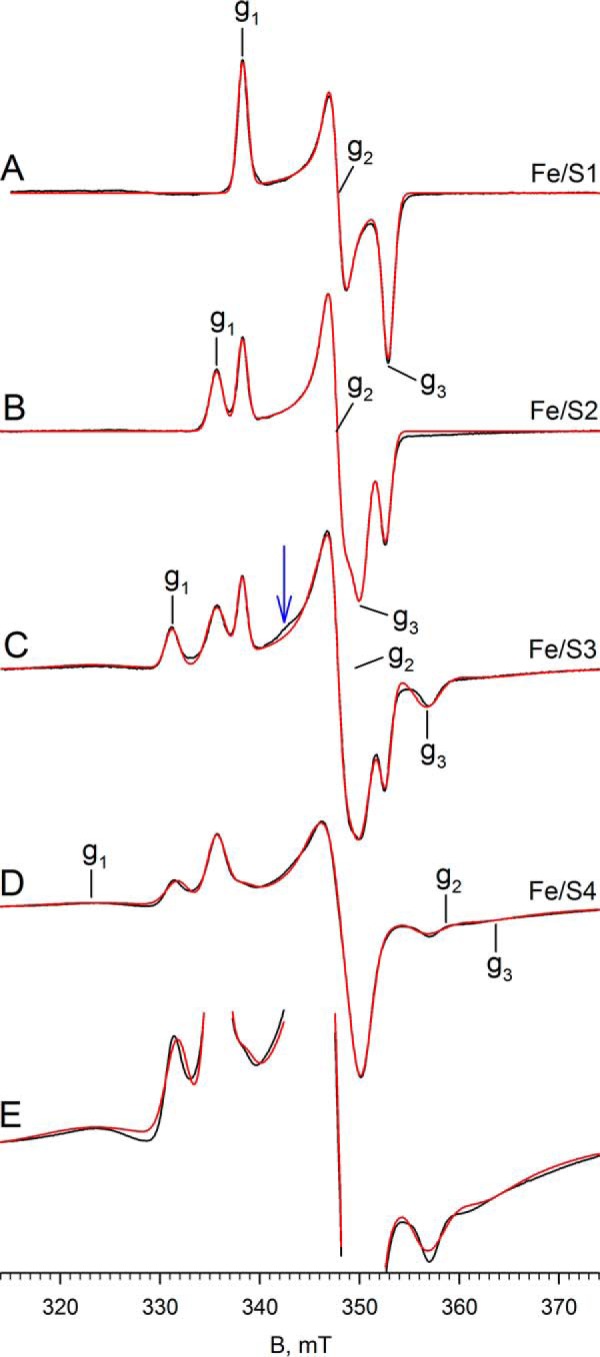
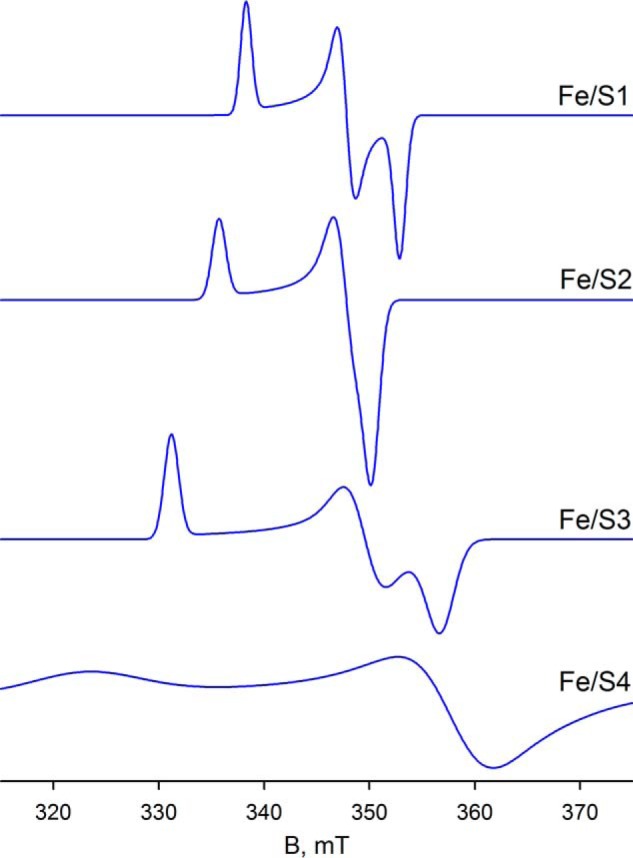
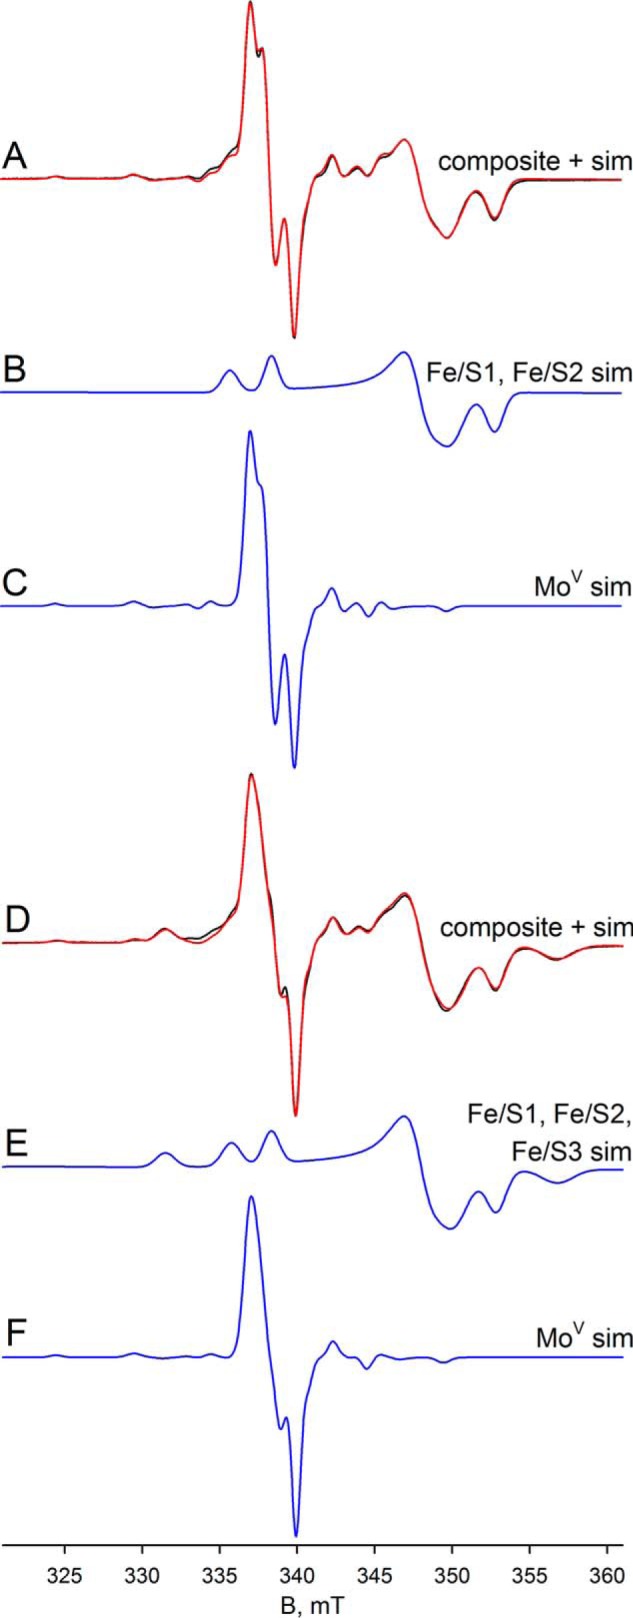
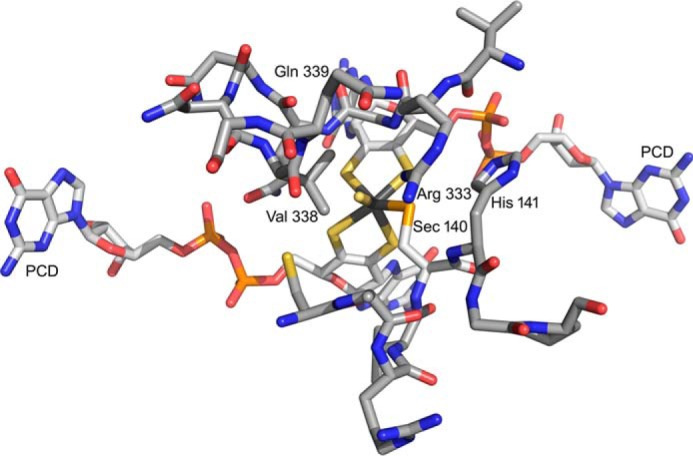
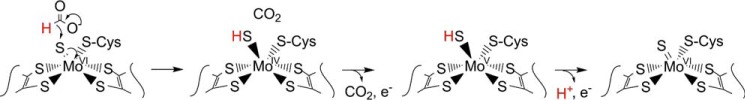
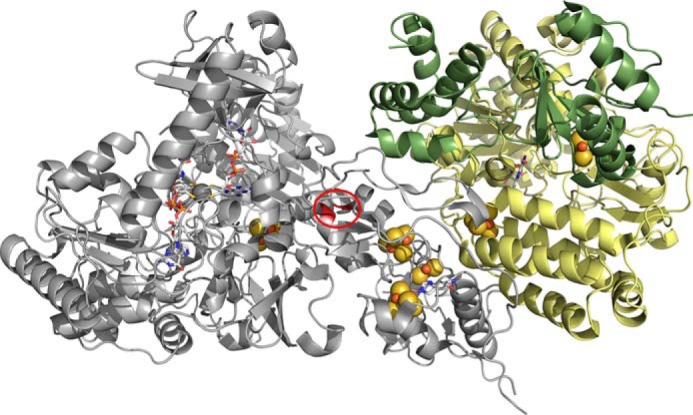
We have examined the rapid reaction kinetics and spectroscopic properties of the molybdenum-containing, NAD(+)-dependent FdsABG formate dehydrogenase from Ralstonia eutropha. We confirm previous steady-state studies of the enzyme and extend its characterization to a rapid kinetic study of the reductive half-reaction (the reaction of formate with oxidized enzyme). We have also characterized the electron paramagnetic resonance signal of the molybdenum center in its Mo(V) state and demonstrated the direct transfer of the substrate Cα hydrogen to the molybdenum center in the course of the reaction. Varying temperature, microwave power, and level of enzyme reduction, we are able to clearly identify the electron paramagnetic resonance signals for four of the iron/sulfur clusters of the enzyme and find suggestive evidence for two others; we observe a magnetic interaction between the molybdenum center and one of the iron/sulfur centers, permitting assignment of this signal to a specific iron/sulfur cluster in the enzyme. In light of recent advances in our understanding of the structure of the molybdenum center, we propose a reaction mechanism involving direct hydride transfer from formate to a molybdenum-sulfur group of the molybdenum center.

Keywords: electron paramagnetic resonance (EPR); enzyme catalysis; enzyme kinetics; enzyme mechanism; iron/sulfur protein; molybdenum.


Figures

FIGURE 1.
FIGURE 1.
Reductive titration of FdsABG. A, oxidized (blue) and sodium dithionite-reduced (black) spectra. B, change in absorbance as a function of reduction. The inset plots the relative absorbance at 550 nm versus relative absorbance at 450 nm, with the diagonal (reflecting strict proportionality in the absorbance change at the two wavelengths) indicated. Details of titration are described under “Experimental Procedures.”
FIGURE 2.
FIGURE 2.
A, pH dependence of kcat for FdsABG. The reactions were performed at 30 °C in a buffer containing 75 mm of malate, K2HPO4, Tris, and glycine, brought to pH 5–10. The fit to the data (solid line) yielded two pKa values of 5.6 and 9.3, respectively. B, Lineweaver-Burk plots for the reaction of FdsABG with formate at the following [NAD+]: 1.62 mm (closed circles), 0.54 mm (open circles), 0.18 mm (closed triangles), and 0.06 mm (open triangles). C, Lineweaver-Burk plots for the reaction of FdsABG with NAD+ at the following [formate]: 3.24 mm (closed circles), 1.08 mm (open circles), 0.36 mm (closed triangles), and 0.12 mm (open triangles). D, secondary plots of 1/y intercept taken from B versus 1/[NAD+]. E, secondary plots of 1/y intercept taken from C. versus 1/[formate]. The reactions in B and C were performed in 75 mm K-PO4, pH 7.7, at 30 °C. Linear regression analysis of plots D and E yielded a KmNAD+ = 130 μm and Kmformate = 310 μm, respectively, and an average kcat of 201 s−1.
FIGURE 3.
FIGURE 3.
Pre-steady-state kinetics for the reduction of FdsABG with formate or [2H]formate. A, rapid scanning stopped flow traces for the reaction of 6 μm of FdsABG with 5 mm formate performed at 10 °C in 75 mm K-PO4, pH 7.7. B, a representative kinetic trace of the reaction of FdsABG with 0.8 mm sodium formate monitored at 450 nm. The trace is best represented by three phases with kobs = 124, 14, and 2.5 s−1, with ΔA = 0.011, 0.017, 0.006, respectively. C, plots of kfast (black circles) and kintermediate (red squares) versus formate concentrations or kfast (black triangles) versus [2H]formate concentrations. All reactions were performed at 10 °C in 75 mm K-PO4, pH 7.7, with 2.5 μm FdsABG. Hyperbolic fits (solid lines) yielded kfast = 140 s−1, Kdformate = 82 μm, kintermediate = 19 s−1, and Kdformate = 230 μm for reaction with formate and kfast = 66 s−1, and Kd[2H]formate = 193 μm for reaction with [2H]formate.
FIGURE 4.
FIGURE 4.
EPR of molybdenum center of FdsABG collected at 150 K. A, MoV-Fe/S EPR spectrum (black) and simulation (red) of FdsABG collected with modulation amplitude = 2 Gauss and microwave power = 4 mW. The sample was prepared under anaerobic conditions by reduction of 100 μm of FdsABG in 75 mm K-PO4, pH 7.5, in the presence of 10 mm KNO3, with 5 mm buffered sodium dithionite. The MoV component represents ∼33% of total spin density. B, simulation of the Fe/S1 contribution to the spectrum in A. C, simulation of the MoV contribution to the spectrum in A. The hyperfine splitting caused by the 25% naturally occurring 95,97Mo (I = 5/2) is shown in the 5-fold expanded spectrum above. D, MoV-Fe/S EPR spectrum (black) and simulation (red) of deuterated FdsABG collected with modulation amplitude = 2 Gauss and microwave power = 4 mW. The sample was prepared under anaerobic conditions by reduction of 100 μm of FdsABG in 75 mm K-PO4, pD 7.1, in the presence of 10 mm KNO3, with 0.4 mm sodium formate. The MoV component represents ∼38% of total spin density. E, simulation of the Fe/S1 contribution to the spectrum in D. F, simulation of the MoV contribution to the spectrum in D. The hyperfine splitting caused by the 25% naturally occurring 95,97Mo (I = 5/2) is shown in the 3-fold expanded spectrum above. Simulation parameters are summarized in Table 1. sim, simulation.
FIGURE 5.
FIGURE 5.
Expanded view of the EPR of molybdenum center of FdsABG from Fig. 4. Superposition of the composite MoV-Fe/S EPR spectra from Fig. 4A (black) with Fig. 4D (red). The line diagram above indicates the location of the principal g tensors (red vertical lines) and the approximate location of the 1H hyperfine splitting (I = 1/2) in the spectrum from Fig. 4A (black vertical lines).
FIGURE 6.
FIGURE 6.
A, MoV-Fe/S EPR spectrum (black) and simulation (red) of FdsABG collected at 150 K with modulation amplitude = 3 Gauss and microwave power = 4 mW. The sample was prepared under anaerobic conditions by reduction of 50 μm of FdsABG in 200 mm Tris-HCl, pH 8.5, in the presence of 10 mm KNO3, with 0.25 mm sodium formate on ice and mixing for 5 s before freezing. The MoV component represents ∼10% of total spin density. B, simulation of the Fe/S1 contribution to the spectrum in A. C, simulation of the MoV contribution to the spectrum in A. D, MoV-Fe/S EPR spectrum (black) and simulation (red) of FdsABG collected at 150 K with modulation amplitude = 2 Gauss and microwave power = 4 mW. The sample in A above was thawed in a room temperature water bath and incubated for an additional 55 s before refreezing. The MoV component represents ∼19% of total spin density. E, simulation of the Fe/S1 contribution to the spectrum in D. F, simulation of the MoV contribution to the spectrum in D. sim, simulation.
FIGURE 7.
FIGURE 7.
EPR of Fe/S centers of FdsABG. A, Fe/S1 EPR spectrum (black) and simulation (red) of FdsABG collected with modulation amplitude = 4 Gauss and microwave power = 4 mW at 100 K. The sample was prepared by thawing out the sample from Fig. 6D under aerobic conditions in a room temperature water bath and incubating for an additional 1 min before refreezing. Locations of g1, g2, and g3 are indicated. B, iron/sulfur EPR spectrum (black) and simulation (red) of FdsABG collected at 60 K with modulation amplitude = 4 Gauss and microwave power = 4 mW. The sample was prepared by incubation of 100 μm of FdsABG in 75 mm K-PO4, pH 7.7, in the absence of 10 mm KNO3 for >6 h. (aerobically at 4 °C), followed by reduction under anaerobic conditions with 5 mm buffered sodium dithionite and further incubation for 1 h before freezing. Locations of g1, g2, and g3 corresponding to the Fe/S2 component of the spectrum are indicated. C, Fe/S EPR spectrum (black) and simulation (red) of FdsABG sample from B collected at 20 K at with modulation amplitude = 3 Gauss and microwave power = 0.2 mW. Locations of g1, g2, and g3 corresponding to the Fe/S3 component of the spectrum are indicated. D, iron/sulfur EPR spectrum (black) and simulation (red) of FdsABG sample from B collected at 20 K at with modulation amplitude = 10 Gauss and microwave power = 100 mW. Locations of g1, g2, and g3 corresponding to the Fe/S4 component of the spectrum are indicated. E, spectrum from D enlarged to show the broad peaks corresponding to Fe/S4. Simulation parameters are summarized in Table 1.
FIGURE 8.
FIGURE 8.
Simulations of EPR spectra for Fe/S1–Fe/S4 from parameters summarized in Table 1. The iron/sulfur clusters are classified by the increasing value of their g1 tensor.
FIGURE 9.
FIGURE 9.
EPR of deuterated molybdenum center of FdsABG collected at 20–60 K. A, MoV-Fe/S EPR spectrum (black) and simulation (red) of FdsABG sample as described in Fig. 4D collected with modulation amplitude = 2 Gauss and microwave power = 0.2 mW at 60 K. The MoV component represents ∼27% of total spin density. B, simulation of the Fe/S1 and Fe/S2 contributions to the spectrum in A. C, simulation of the MoV contribution to the spectrum in A. D, MoV-Fe/S EPR spectrum (black) and simulation (red) of FdsABG sample from A. above collected with modulation amplitude = 2 Gauss and microwave power = 0.02 mW at 20 K. The MoV component represents ∼16% of total spin density. E, simulation of the Fe/S1–Fe/S3 contributions to the spectrum in D. F, simulation of the MoV contribution to the spectrum in D. The simulation parameters are summarized in Table 1. sim, simulation.
FIGURE 10.
FIGURE 10.
The active site of the FdhF formate dehydrogenase from E. coli (PDB code 1FDO). The molybdenum is at the center of the figure, coordinated by the two equivalents of pyranopterin cytidine dinucleotide (PCD), a terminal sulfido (represented as a coordinated water in the original PDB file), and Sec-140. The substrate binding site is delineated by two loops consisting of 137ARVUHGP143 and 328GVNPLRGQNNVQG340. Arg-333 has been proposed to interact with the negatively charged substrate. In these two stretches, only two residues differ in the FdsA subunit of the R. eutropha formate dehydrogenase: Sec-140, which is a Cys that coordinates the molybdenum in FdsA, and Val-338, which is a Leu in FdsA.
FIGURE 11.
FIGURE 11.
A proposed hydride transfer mechanism for the formate dehydrogenases. Beginning with the ionized substrate, the second carbon-oxygen double bond forms displacing hydride, which attacks the molybdenum-sulfur group, bringing about the formal two-electron reduction of the metal with concomitant transfer of the Cα-H to the sulfur.
FIGURE 12.
FIGURE 12.
A structural model for the R. eutropha formate dehydrogenase. The molybdenum center is at left, and the FMN is at right, with the several iron/sulfur clusters intervening. The model is based on homologies to the T. thermophilus NADH dehydrogenase (PDB code 3IAM) and the E. coli formate dehydrogenase (PDB code 1AA6), with the position of the additional [4Fe-4S] cluster present in FdsA but absent in Nqo3 indicated by the red circle.

References

    1. Hille R., Hall J., and Basu P. (2014) The mononuclear molybdenum enzymes. Chem. Rev. 114, 3963–4038 - PMC - PubMed
    1. Sazanov L. A., and Hinchliffe P. (2006) Structure of the hydrophilic domain of respiratory complex I from Thermus thermophilus. Science 311, 1430–1436 - PubMed
    1. Efremov R. G., Baradaran R., and Sazanov L. A. (2010) The architecture of respiratory complex I. Nature 465, 441–445 - PubMed
    1. Oh J. I., and Bowien B. (1998) Structural analysis of the fds operon encoding the NAD+-linked formate dehydrogenase of Ralstonia eutropha. J. Biol. Chem. 273, 26349–26360 - PubMed
    1. Boyington J. C., Gladyshev V. N., Khangulov S. V., Stadtman T. C., and Sun P. D. (1997) Crystal structure of formate dehydrogenase H: catalysis involving Mo, molybdopterin, selenocysteine, and an Fe4S4 cluster. Science 275, 1305–1308 - PubMed

Publication types

MeSH terms