. 2015 Nov 9;211(3):517-32.
doi: 10.1083/jcb.201504059.

Bub3-BubR1-dependent sequestration of Cdc20Fizzy at DNA breaks facilitates the correct segregation of broken chromosomes

Affiliations

Bub3-BubR1-dependent sequestration of Cdc20Fizzy at DNA breaks facilitates the correct segregation of broken chromosomes

Nicolas Derive et al. J Cell Biol. .

Abstract

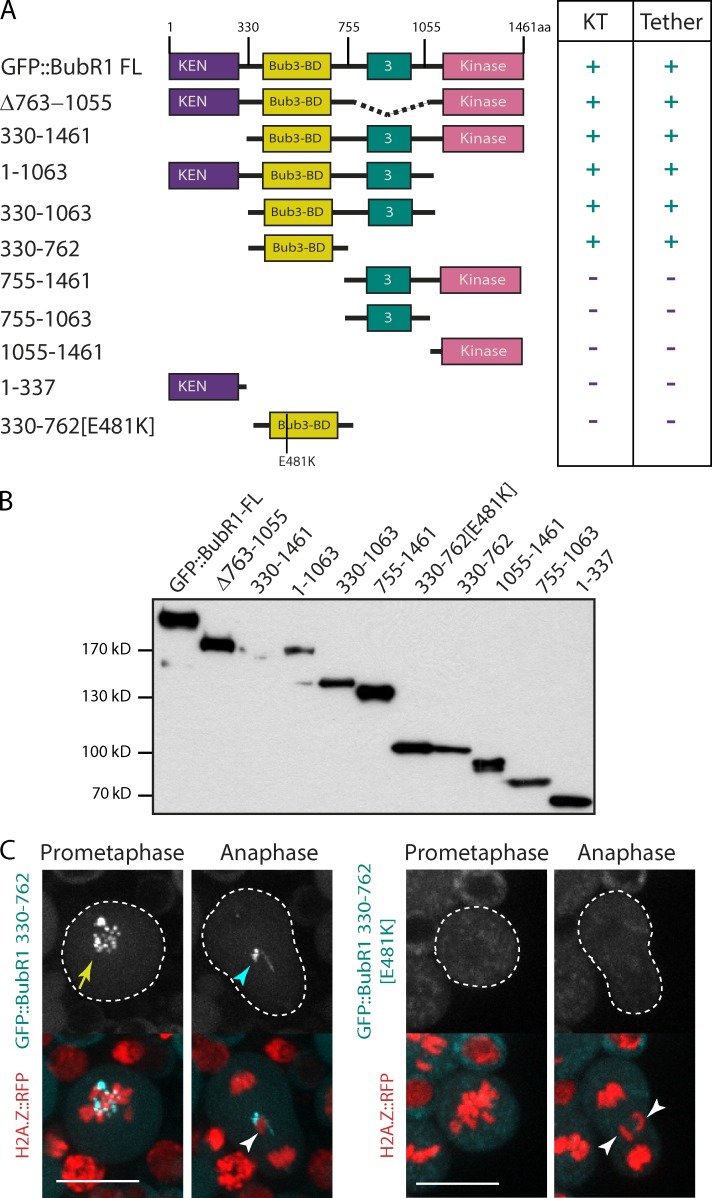
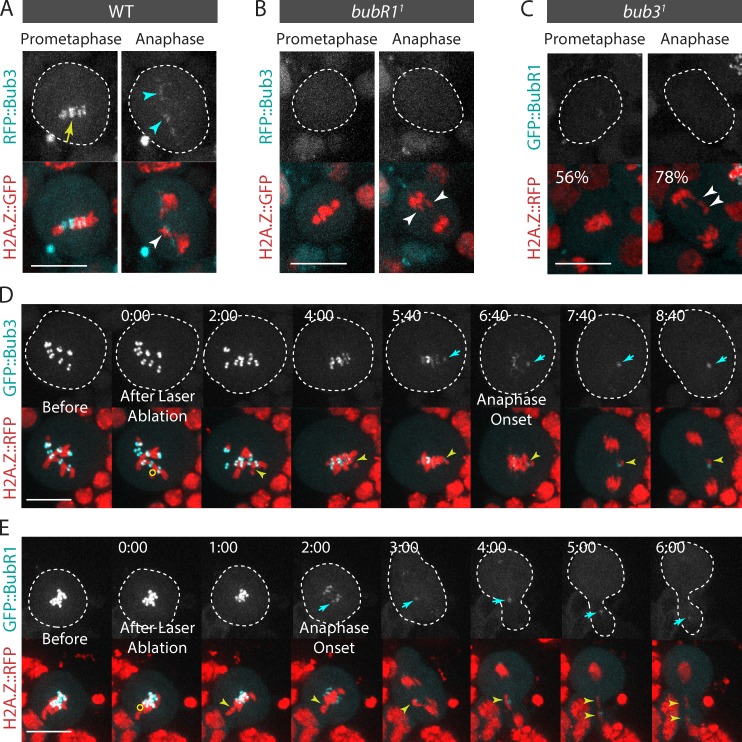
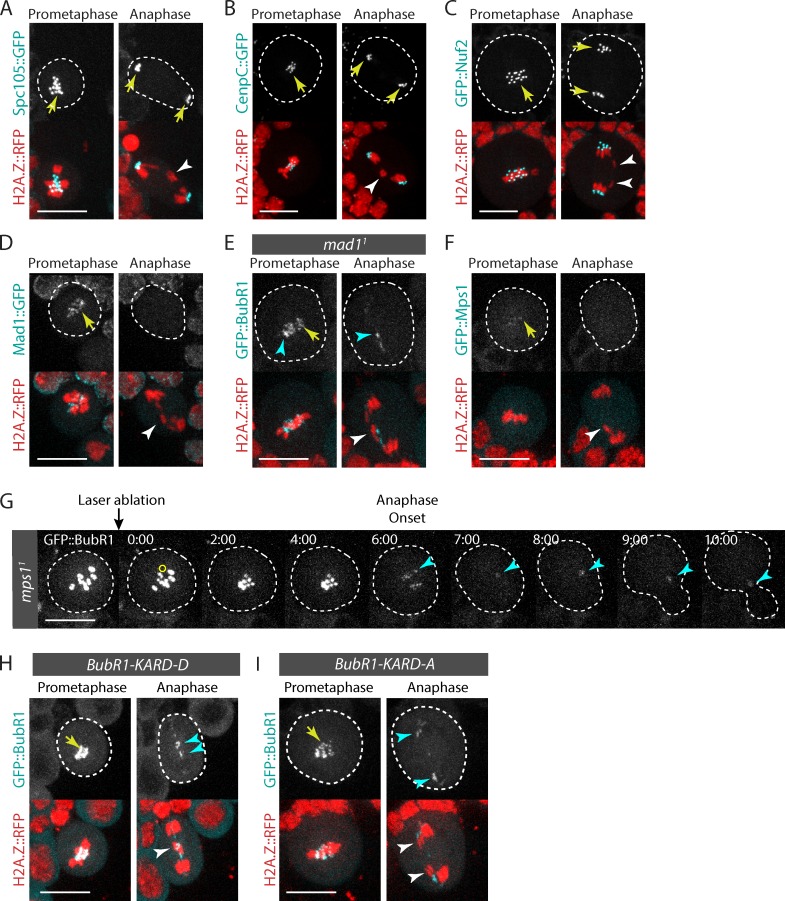
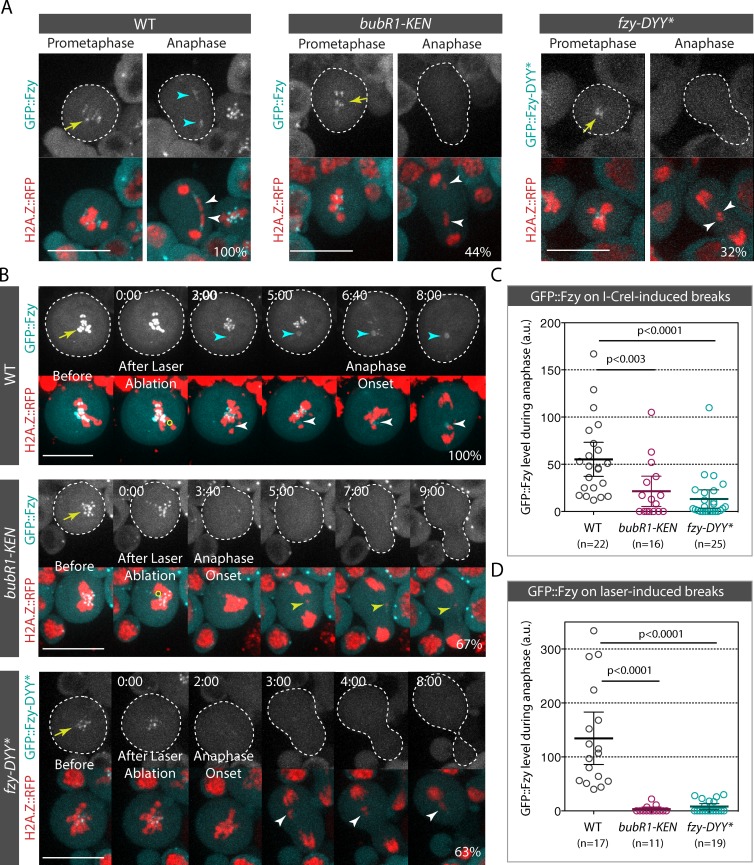
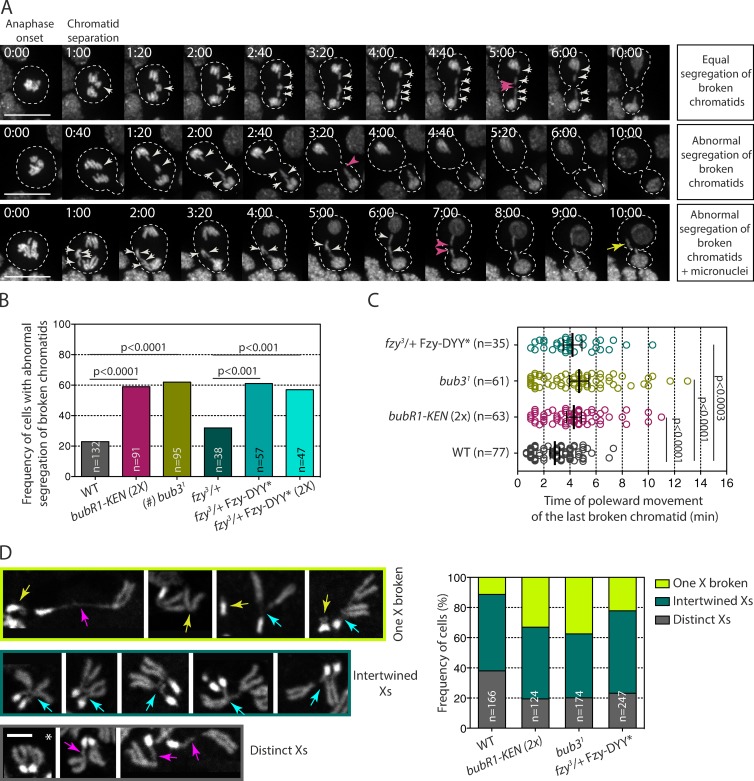
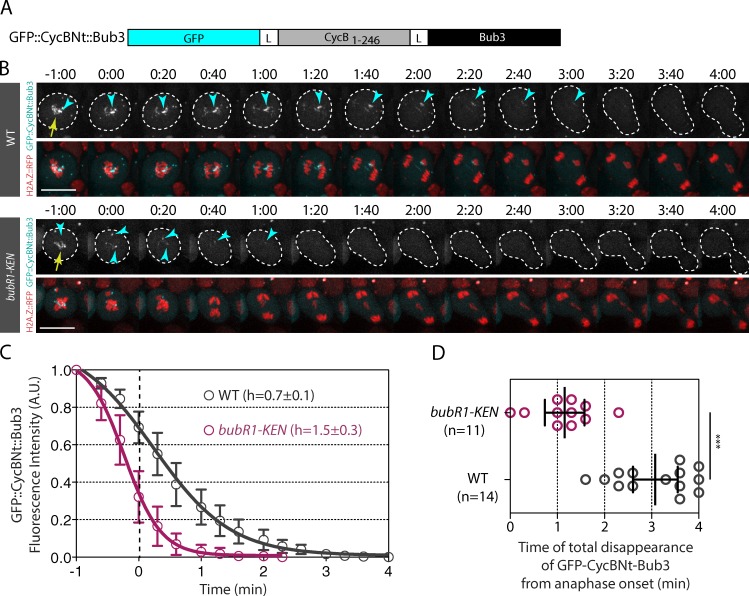
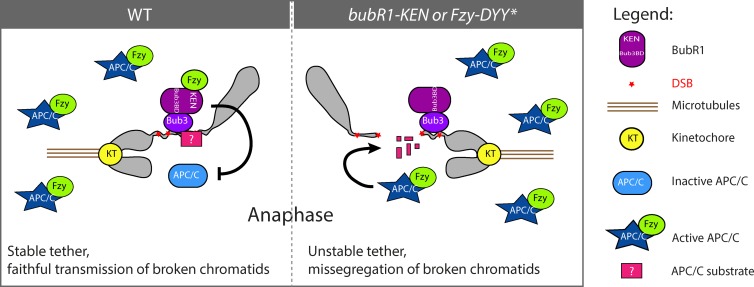
The presence of DNA double-strand breaks during mitosis is particularly challenging for the cell, as it produces broken chromosomes lacking a centromere. This situation can cause genomic instability resulting from improper segregation of the broken fragments into daughter cells. We recently uncovered a process by which broken chromosomes are faithfully transmitted via the BubR1-dependent tethering of the two broken chromosome ends. However, the mechanisms underlying BubR1 recruitment and function on broken chromosomes were largely unknown. We show that BubR1 requires interaction with Bub3 to localize on the broken chromosome fragments and to mediate their proper segregation. We also find that Cdc20, a cofactor of the E3 ubiquitin ligase anaphase-promoting complex/cyclosome (APC/C), accumulates on DNA breaks in a BubR1 KEN box-dependent manner. A biosensor for APC/C activity demonstrates a BubR1-dependent local inhibition of APC/C around the segregating broken chromosome. We therefore propose that the Bub3-BubR1 complex on broken DNA inhibits the APC/C locally via the sequestration of Cdc20, thus promoting proper transmission of broken chromosomes.


Figures

Figure 1.
Figure 1.
The Bub3-BD of BubR1 is necessary and sufficient for BubR1 localization on the tether. (A) Scheme of BubR1 full-length (FL) domains identified with a secondary structural prediction algorithm (globprot), and the BubR1 truncated versions along with their localization (+) or not (−) on the kinetochore (KT) or tether. The numbers correspond to the position of the first and last amino acid of the BubR1 truncation construct. The 330–762 [E481K] construct contains a substitution of E481 by K. The BubR1 constructs are fused with GFP on their N terminus. (B) Western blot of the different GFP::BubR1 constructs from transgenic adult flies. (C) Images of live neuroblasts expressing I-CreI and labeled with H2A.Z::RFP and the indicated GFP::BubR1 constructs (also see Video 1 and Video 2). The kinetochore and tether localization of the GFP::BubR1 constructs are indicated with a yellow arrow and a cyan arrowhead. The white arrowheads point to the I-CreI–induced acentric chromatids. The cells are delineated with white dotted lines. Bars, 10 µm.
Figure 2.
Figure 2.
Bub3 and BubR1 localize on I-CreI– and laser-induced DNA breaks. (A) Bub3 localizes on the I-CreI–induced tether (also see Video 3). Time-lapse images of WT neuroblasts expressing H2A.Z::GFP and RFP::Bub3 after I-CreI induction. The yellow arrow and cyan arrowheads indicate the localization of RFP::Bub3 on kinetochores and tethers. (B) Bub3 does not localize to the kinetochore or the tether in bubR11 mutants. Time-lapse images of bubR11 mutant neuroblasts expressing H2A.Z::GFP and RFP::Bub3 after I-CreI induction. (C) BubR1 does not localize to the kinetochore or the tether in 56% and 78% of bub31 mutant cells (n = 9). Time-lapse images of bub31 mutant neuroblasts expressing H2A.Z::RFP and GFP::BubR1 after I-CreI induction. The white arrowheads point to the I-CreI–induced acentric chromatids. (D and E) Bub3 (D) and BubR1 (E) localize on laser-induced DNA damage during mitosis. Time-lapse images of neuroblasts expressing H2A.Z::RFP and GFP::Bub3, or GFP::BubR1, before and after laser ablation (also see Video 4). The yellow circles correspond to the zones of laser ablation. The cyan arrows point to the accumulation of Bub3 or BubR1 at the site of the chromosome damage. The yellow arrowheads indicate the laser-induced damage. Time (given in minutes/seconds) 0:00 corresponds to the first acquisition immediately after laser ablation. The cells are delineated with dotted lines. Bars, 10 µm.
Figure 3.
Figure 3.
DNA breaks do not induce neokinetochore formation. (A–D and F) Time-lapse images of neuroblasts expressing H2A.Z::RFP and Spc105::GFP (A), CenpC::GFP (B), GFP::Nuf2 (C), Mad1::GFP (D), and GFP::Mps1 (F) after I-CreI expression. The white arrowheads point to the I-CreI–induced acentric chromatids. Yellow arrows indicate the localization of the GFP-labeled proteins at the kinetochore. (E) Mad1 is not required for BubR1 localization on broken chromatids. Time-lapse images of a mad11 mutant neuroblast expressing I-CreI and labeled with H2A.Z::RFP and GFP::BubR1. The white arrowhead indicates I-CreI–induced acentric chromatids. The yellow arrow and cyan arrowheads indicate the localization of GFP::BubR1 at the kinetochore and tether. (G) Mps1 is not required for BubR1 localization on broken chromatids. Time-lapse images of mps11 mutant neuroblast labeled with GFP::BubR1 before and after laser ablation. The yellow circle corresponds to the zone of laser ablation. The cyan arrowheads indicate the appearance of GFP::BubR1 at the site of chromosome damage. Time (given in minutes/seconds) 0:00 corresponds to the first acquisition immediately after laser ablation. (H and I) BubR1 localization on DNA breaks does not require Polo-dependent phosphorylation of the BubR1 KARD motif. Time-lapse images of neuroblasts expressing I-CreI labeled with H2A.Z::RFP. The neuroblasts express either the GFP::BubR1-KARD-D mutant, where the putative Polo-dependent phosphorylation sites in the KARD motif are replaced by aspartate (H), or GFP::BubR1-KARD-A, where the same residues are mutated to alanine (I). The white arrowheads indicate the I-CreI–induced acentric chromatids. Yellow arrows and cyan arrowheads point to the localization of GFP::BubR1-KARD-D and GFP::BubR1-KARD-A on the kinetochore and tether. Cells are delineated with white dotted lines. Bars, 10 µm.
Figure 4.
Figure 4.
Fzy is recruited on I-CreI– or laser-induced breaks in a BubR1 KEN box–dependent manner. (A) Time-lapse images of WT (also see Video 5), bubR1-KEN (also see Video 6), and fzy-DYY* neuroblasts expressing I-CreI. WT and bubR1-KEN mutant cells express GFP::Fzy, and fzy-DYY* mutant cells express GFP::Fzy-DYY*. The yellow arrows and cyan arrowheads indicate the localization of GFP::Fzy and GFP::Fzy-DYY* on the kinetochore and tether. The white arrowheads indicate the I-CreI–induced acentric chromatids. 100% of WT cells exhibited GFP::Fzy signal on the tether (n = 22). In contrast, no GFP::Fzy signal on the tether was detected in 44% of bubR1-KEN mutant cells (n = 16). GFP::Fzy-DYY* signal was not visible in 32% of cells (n = 25). (B) Time-lapse images of WT (also see Video 7), bubR1-KEN (also see Video 8), and fzy-DYY* mutant cells before and after laser ablation. The yellow arrows indicate the accumulation of GFP::Fzy and GFP::Fzy-DYY* on kinetochores. The yellow circles correspond to the zones of laser ablation. Time (given in minutes/seconds) 0:00 corresponds to the first acquisition immediately after laser ablation. The white arrowheads indicate laser-induced damage. The cyan arrowheads show the appearance of GFP::Fzy at the site of chromosome damage. For WT cells, the percentage represents the frequency of cells with GFP::Fzy signal on DNA breaks (n = 17). In the bubR1-KEN mutant, the percentage denotes the frequency of cells without GFP::Fzy signal on laser-induced damage (n = 11). Finally, for the fzy-DYY* mutant, the percentage indicates the frequency of cells with no detectable GFP::Fzy-DYY* signal on laser-induced breaks (n = 19). The cells are delineated with dotted lines. Bars, 10 µm. (C) Scatter dot plot of GFP::Fzy and GFP::Fzy-DYY* levels at the site of the I-CreI–induced tether during anaphase in WT, bubR1-KEN, and fzy-DYY* mutants. (D) Scatter dot plot of GFP::Fzy and GFP-Fzy-DYY* levels at the site of the laser-induced breaks during anaphase. (C and D) n = number of cells. The GFP level is normalized to the cytoplasmic GFP signal (see Materials and methods section Image analysis for quantification details). A Mann-Whitney nonparametric test was used to calculate p-values. Error bars represent mean ± 95% confidence interval. a.u., arbitrary units.
Figure 5.
Figure 5.
bubR1-KEN, bub31, and fzy-DYY* mutants exhibit severe defects in broken chromatid segregation. (A) Time-lapse images of neuroblasts expressing I-CreI and labeled with H2A.Z::RFP. The top row shows an example of a dividing cell with equal partition of the broken X chromatids (white arrows), which produces euploid daughter cells. The middle and bottom rows show examples of cells with abnormal segregation of broken chromatids, where three X broken chromatids segregate in one daughter cell (white arrows). These divisions will produce two aneusomic daughter cells with, in some cases, visible micronuclei (yellow arrow, bottom). The pink arrowheads indicate the time at which the last acentric fragments move poleward. Time is given in minutes/seconds. Bars, 10 µm. (B) Histogram showing the frequency of neuroblast divisions with abnormal segregation of broken chromatids after I-CreI expression. n = number of cells. A Fisher extract test was used to calculate the p-value. (#) Given that bub31 mutant cells exhibit a high frequency of anaphase with whole lagging chromosomes (Basu et al., 1999; Logarinho et al., 2004; Lopes et al., 2005), cells in which no clear lagging broken chromatids could be followed because of extensive chromosome segregation defects were excluded from our analysis. (C) Scatter dot plot showing the time at which the last acentric chromatid starts moving poleward. The black lines correspond to mean ± 95% confidence interval. Time 0:00 corresponds to anaphase onset. n = number of cells. A Mann-Whitney nonparametric test was used for calculating p-values. (D) DAPI staining of X chromosomes from fixed neuroblasts after I-CreI expression. The bottom row illustrates cells exhibiting two distinct X chromosomes with no apparent tether, indicated by an asterisk, or apparent tether, indicated by pink arrows. The middle row represents intertwined X homologues (cyan arrows), and the top row shows an example of cells with one X broken fragment (yellow arrows). The histogram shows the frequency of cells with either two distinct Xs with or without tethers, intertwined X homologues, or at least one X broken. n = number of cells. Bar, 2 µm. bubR1-KEN(2X) corresponds to bubR11 null cells expressing two doses of the RFP::BubR1-KEN transgene; fzy3/+ corresponds to fzy3 heterozygote mutants cells; and fzy3/+ Fzy-DYY* and fzy3/+ Fzy-DYY* (2X) correspond to the fzy3 heterozygote carrying one or two doses of the GFP::Fzy-DYY* transgene.
Figure 6.
Figure 6.
The APC/C synthetic substrate GFP::CycBNt::Bub3 is maintained on the tether during early anaphase in a BubR1 KEN box–dependent manner. (A) Scheme of the APC/C synthetic substrate GFP::CycBNt::Bub3. The N terminus (including the amino acids 1–246) of Cyclin B (CycB1–246) was fused on its N terminus to GFP and on its C terminus to full-length Bub3. The CycBNt sequence was flanked with a 4× glycine–alanine linker (L). (B) Time-lapse images of WT and bubR1-KEN mutant cells after I-CreI induction labeled with H2A.Z::RFP and GFP::CycBNt::Bub3. The kinetochore and tether localization of GFP::CycNt::Bub3 are indicated with yellow arrows and cyan arrowheads, respectively. Bar, 10 µm. (C) Quantitative analysis of the disappearance of the GFP::CycBNt::Bub3 signal on kinetochores and tethers. The graph shows the fluorescence intensity of GFP signal on kinetochores and tethers over time (see Fig. S5 for raw data and Materials and methods section Image analysis for details on the quantification). The fluorescence intensities were normalized to the fluorescence intensity measured at the time point −1 min. The 0 of the x axis corresponds to anaphase onset as defined by the onset of sister chromatid separation. The signal was measured every 20 s. (D) Scatter dot plot showing the time of complete disappearance of the signal of GFP::CycBNt::Bub3 in WT and bubR1-KEN mutant cells expressing I-CreI. The time starts at anaphase onset. The black lines correspond to mean ± 95% confidence interval. A Mann-Whitney nonparametric test was used to calculate p-values (***, P < 0.001). A.U., arbitrary units.
Figure 7.
Figure 7.
Model for Bub3–BubR1 function on the tether/DNA breaks. The BubR1–Bub3 complex sequesters Fzy on broken chromosomes from prometaphase to late anaphase, preventing activation of the APC/C locally and transiently. This inhibition may prevent the APC/C-dependent degradation of a key factor (pink square with question mark) required to maintain the two broken fragments tethered and to facilitate their proper segregation. In bubR1-KEN or fzy-DYY* mutants, the Fzy-mediated activation of the APC/C around the broken fragments allows the premature degradation of the unknown factor, which impairs the tethering of the broken fragments and their correct segregation.

Similar articles

Cited by

References

    1. Althoff F., Karess R.E., and Lehner C.F.. 2012. Spindle checkpoint-independent inhibition of mitotic chromosome segregation by Drosophila Mps1. Mol. Biol. Cell. 23:2275–2291. 10.1091/mbc.E12-02-0117 - DOI - PMC - PubMed
    1. Barefield C., and Karlseder J.. 2012. The BLM helicase contributes to telomere maintenance through processing of late-replicating intermediate structures. Nucleic Acids Res. 40:7358–7367. 10.1093/nar/gks407 - DOI - PMC - PubMed
    1. Basu J., Logarinho E., Herrmann S., Bousbaa H., Li Z., Chan G.K., Yen T.J., Sunkel C.E., and Goldberg M.L.. 1998. Localization of the Drosophila checkpoint control protein Bub3 to the kinetochore requires Bub1 but not Zw10 or Rod. Chromosoma. 107:376–385. 10.1007/s004120050321 - DOI - PubMed
    1. Basu J., Bousbaa H., Logarinho E., Li Z., Williams B.C., Lopes C., Sunkel C.E., and Goldberg M.L.. 1999. Mutations in the essential spindle checkpoint gene bub1 cause chromosome missegregation and fail to block apoptosis in Drosophila. J. Cell Biol. 146:13–28. 10.1083/jcb.146.1.13 - DOI - PMC - PubMed
    1. Baumann C., Körner R., Hofmann K., and Nigg E.A.. 2007. PICH, a centromere-associated SNF2 family ATPase, is regulated by Plk1 and required for the spindle checkpoint. Cell. 128:101–114. 10.1016/j.cell.2006.11.041 - DOI - PubMed

Publication types

MeSH terms

LinkOut - more resources