. 2015 Nov 24;112(47):14533-8.
doi: 10.1073/pnas.1515650112. Epub 2015 Nov 9.

Ultraflexible, large-area, physiological temperature sensors for multipoint measurements

Affiliations

Ultraflexible, large-area, physiological temperature sensors for multipoint measurements

Tomoyuki Yokota et al. Proc Natl Acad Sci U S A. .

Abstract

We report a fabrication method for flexible and printable thermal sensors based on composites of semicrystalline acrylate polymers and graphite with a high sensitivity of 20 mK and a high-speed response time of less than 100 ms. These devices exhibit large resistance changes near body temperature under physiological conditions with high repeatability (1,800 times). Device performance is largely unaffected by bending to radii below 700 µm, which allows for conformal application to the surface of living tissue. The sensing temperature can be tuned between 25 °C and 50 °C, which covers all relevant physiological temperatures. Furthermore, we demonstrate flexible active-matrix thermal sensors which can resolve spatial temperature gradients over a large area. With this flexible ultrasensitive temperature sensor we succeeded in the in vivo measurement of cyclic temperatures changes of 0.1 °C in a rat lung during breathing, without interference from constant tissue motion. This result conclusively shows that the lung of a warm-blooded animal maintains surprising temperature stability despite the large difference between core temperature and inhaled air temperature.

Keywords: biomedical devices; flexible electronics; organic electronics; temperature sensor.


Conflict of interest statement

The authors declare no conflict of interest.

Figures
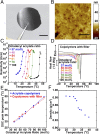
Fig. 1.
Fig. 1.
Characteristics of tunable temperature sensors with high sensitivity. (A) Photograph of a film of copolymer with graphite filler. (Scale bar, 1 cm.) (B) AFM image of the surface of a film of copolymer with filler at 26 °C. (Scale bar,10 μm.) (C) Temperature dependence of the resistivity of the copolymer with filler with various comonomer compositions. Control of the sensing temperature of OA/methyl acrylate copolymers with filler is achieved by changing the mol ratio of OA from 37% to 100%. (D) The DSC melt endotherms of the copolymers with filler. The peak temperature is raised by the increased mol ratio of OA. (E) Comparison of the peak temperature for the DSC melt endotherms of the acrylate copolymers and copolymers with filler. (F) The density of an acrylate copolymer was measured by the fixed volume expansion method. Expansion of the polymer matrix during a melt transition results in a decrease in polymer density.
Fig. 2.
Fig. 2.
Cyclic, mechanical, and environmental stability of physiological temperature sensors. (A) Heat cycling test for a temperature sensor with 54.0% OA with a lateral structure. Each cycle comprises two steps: heating from 29.8 °C to 37.0 °C and cooling from 37.0 °C to 29.8 °C. (B) The temperature dependence of the resistivity of the temperature sensor with a lateral structure. Black circles, blue squares, and red triangles represent resistance values of 29.8 °C, 33.3 °C, and 34 °C, respectively. (C) Electrical characteristics of the temperature sensor with a 1-μm-thick parylene passivation layer. Black circles and red triangles represent the characteristics in atmosphere and saline, respectively. (D) Flexibility of the temperature sensor. Black and red dots represent the initial resistivity and the resistivity after bending to a radius of 700 μm, respectively. Devices were measured while flat.
Fig. 3.
Fig. 3.
Flexible temperature sensor sheet for large-area temperature mapping. (A) Picture of our flexible temperature sensor sheet. (Scale bar, 1 cm.) (B) Cross-sectional illustration of a flexible large-area active-matrix sensor with 12 × 12 temperature pixels. (C) Temperature dependence of the electrical characteristics after the integration of the temperature sensor and organic transistor. (D) Temperature dependence of the resistivity of the temperature sensor and the on-current of the organic transistor with the temperature sensor. (E) Area of a flexible temperature sensor sheet heated to 34 °C. (Scale bar, 1 cm.) (F) The spatial temperature gradient when a heated object is placed on the sensing sheet. (G) Real-time measurement of the temperature distribution. (Left) Temperature mapping before touching. (Right) Temperature mapping after touching the sensor sheet with a finger.
Fig. 4.
Fig. 4.
Measurement of lung temperature during respiration (A) Setup of the animal experiments. A median sternotomy was conducted to expose the lung during artificial respiration. (B) The temperature sensor (Left) was inserted between the cranial lobe (Cr) and median lobe (M) of the right lung during artificial respiration. (Scale bar, 5 mm.) (C) Temperature measurement of the respirated lung as heat is exchanged between the lung tissue and air. (D) Time course of the temperature of the living lung. (Black: temperature output from the sensor, green: displacement of the lung surface.) The lung temperature periodically fluctuated due to the heat exchange in synchronization with breathing. The inspiration and expiration caused the respective decrease and increase in temperature. (E) Temperature mapping measurement of the lung by using a 5 × 5 array of temperature sensors. (F) Temperature mapping of the rat lung.

Similar articles

Cited by

References

    1. Arora N, et al. Effectiveness of a noninvasive digital infrared thermal imaging system in the detection of breast cancer. Am J Surg. 2008;196(4):523–526. - PubMed
    1. Shevelev IA. Temperature topography of the brain cortex: Thermoencephaloscopy. Brain Topogr. 1992;5(2):77–85. - PubMed
    1. Bagavathiappan S, et al. 2009. Infrared thermal imaging for detection of peripheral vascular disorders. J Med Phys 34(1):43–47.
    1. Kim DH, et al. Epidermal electronics. Science. 2011;333(6044):838–843. - PubMed
    1. Viventi J, et al. Flexible, foldable, actively multiplexed, high-density electrode array for mapping brain activity in vivo. Nat Neurosci. 2011;14(12):1599–1605. - PMC - PubMed

Publication types