. 2015 Nov 24;112(47):14569-74.
doi: 10.1073/pnas.1509757112. Epub 2015 Nov 9.

Choosing experiments to accelerate collective discovery

Affiliations

Choosing experiments to accelerate collective discovery

Andrey Rzhetsky et al. Proc Natl Acad Sci U S A. .

Abstract

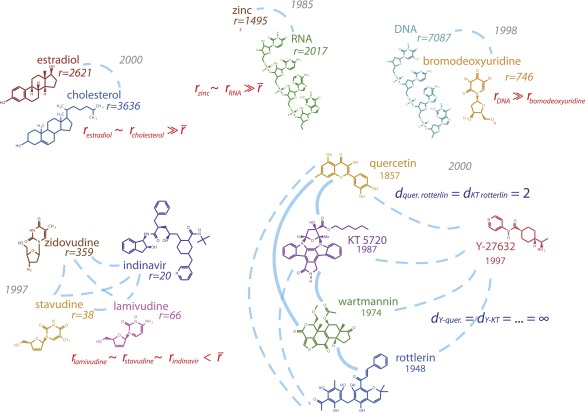
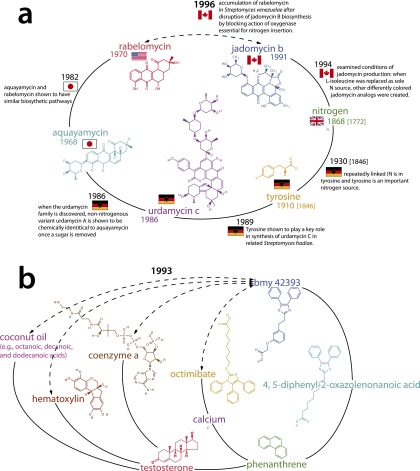
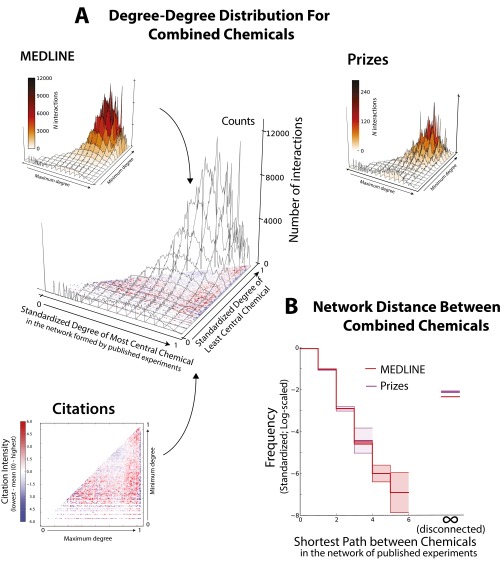
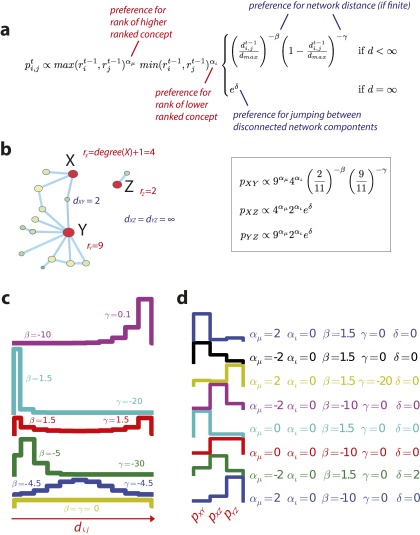
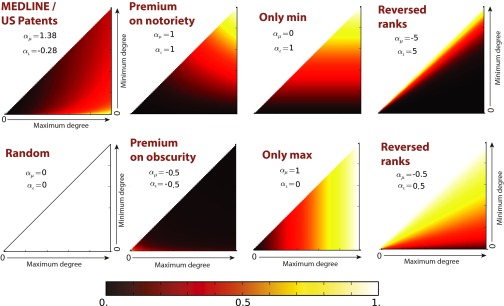
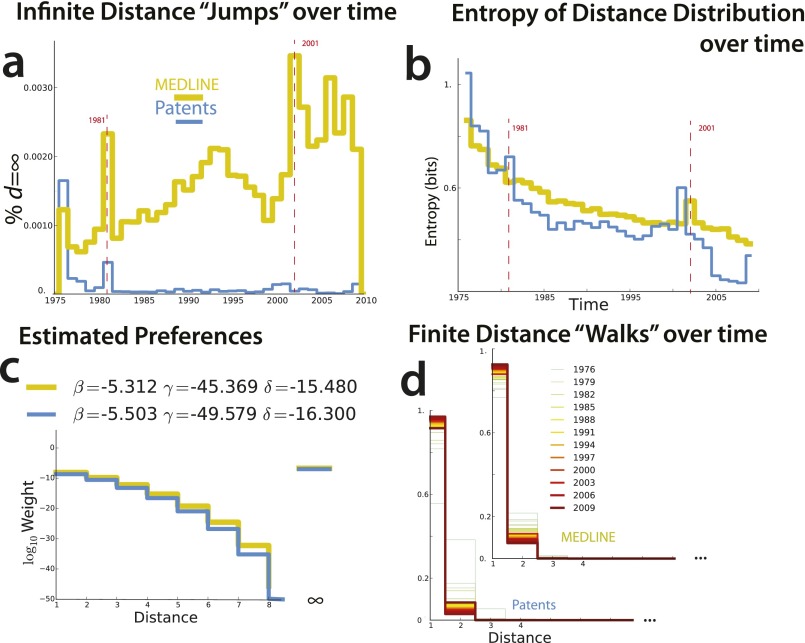
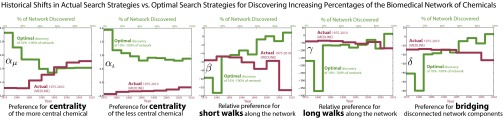
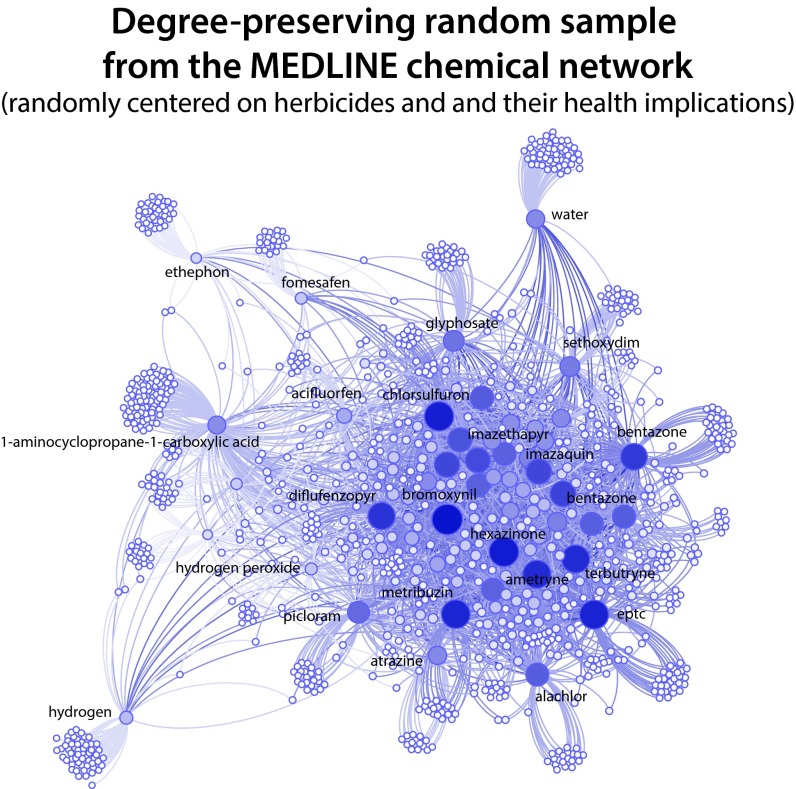
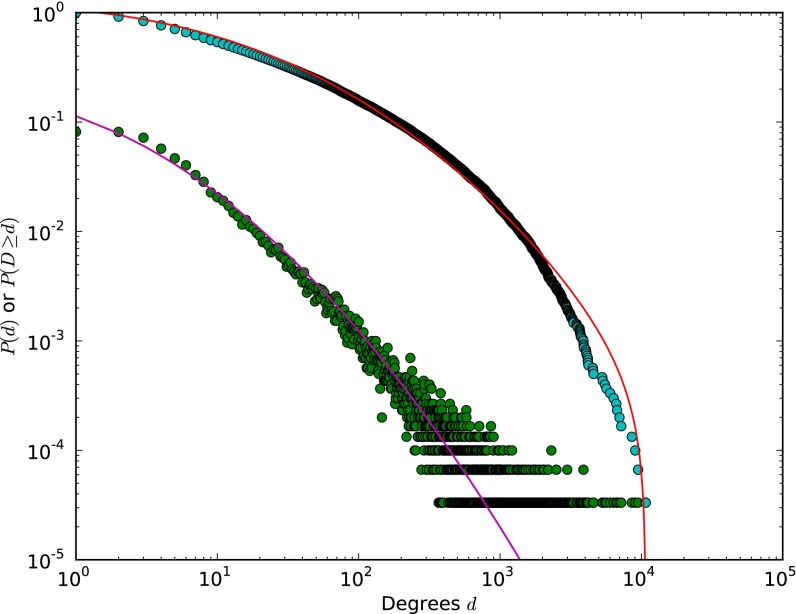
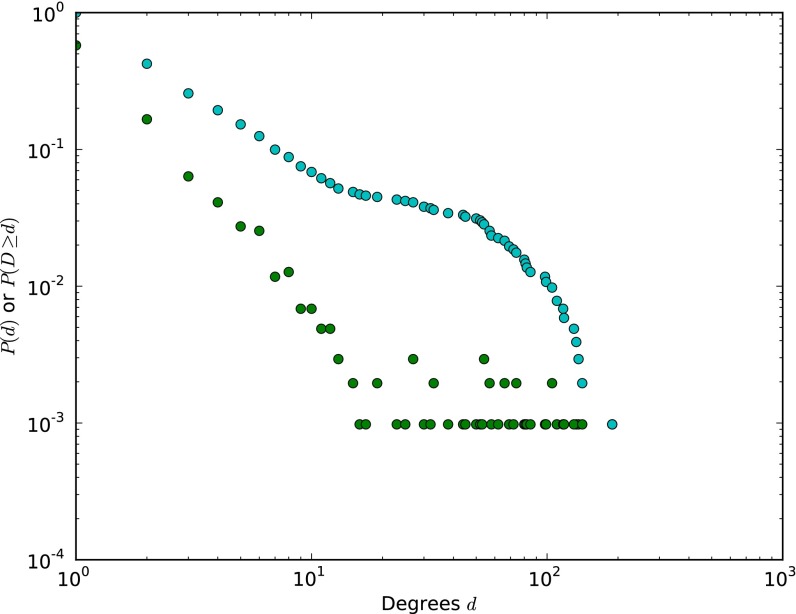
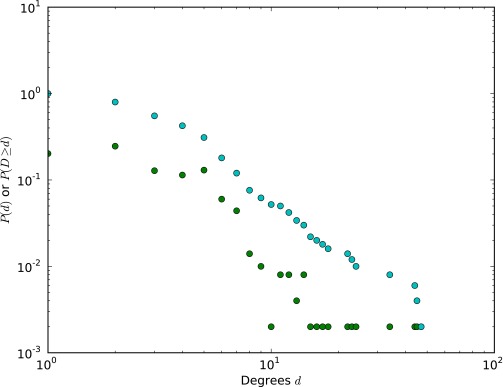
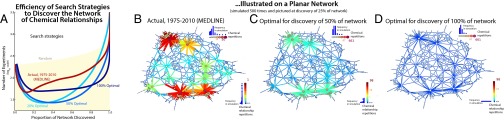
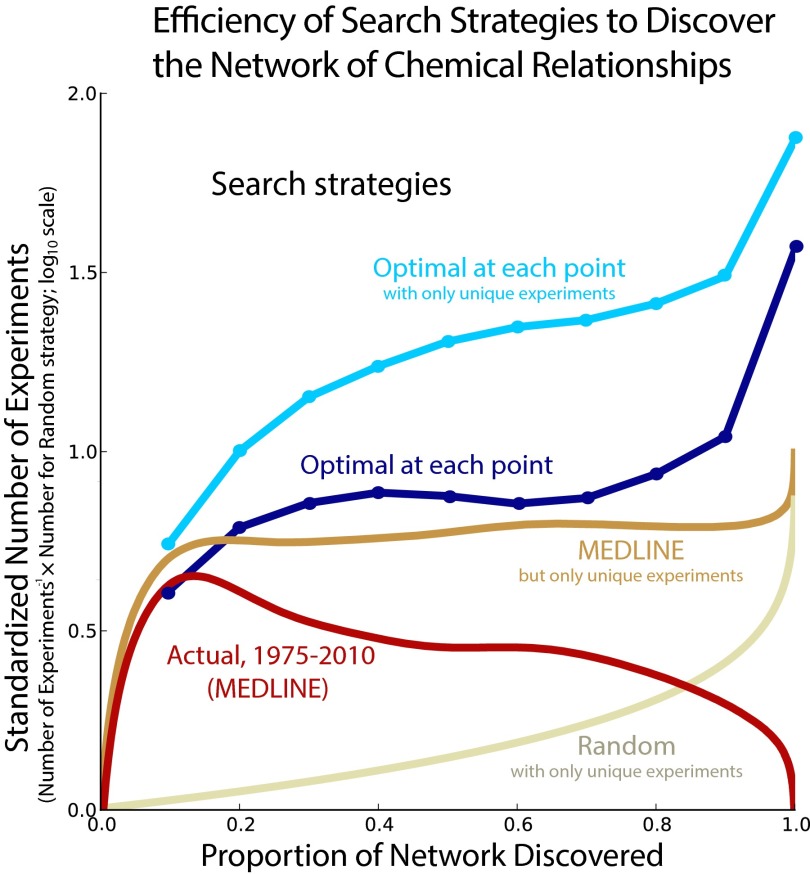
A scientist's choice of research problem affects his or her personal career trajectory. Scientists' combined choices affect the direction and efficiency of scientific discovery as a whole. In this paper, we infer preferences that shape problem selection from patterns of published findings and then quantify their efficiency. We represent research problems as links between scientific entities in a knowledge network. We then build a generative model of discovery informed by qualitative research on scientific problem selection. We map salient features from this literature to key network properties: an entity's importance corresponds to its degree centrality, and a problem's difficulty corresponds to the network distance it spans. Drawing on millions of papers and patents published over 30 years, we use this model to infer the typical research strategy used to explore chemical relationships in biomedicine. This strategy generates conservative research choices focused on building up knowledge around important molecules. These choices become more conservative over time. The observed strategy is efficient for initial exploration of the network and supports scientific careers that require steady output, but is inefficient for science as a whole. Through supercomputer experiments on a sample of the network, we study thousands of alternatives and identify strategies much more efficient at exploring mature knowledge networks. We find that increased risk-taking and the publication of experimental failures would substantially improve the speed of discovery. We consider institutional shifts in grant making, evaluation, and publication that would help realize these efficiencies.

Keywords: complex networks; computational biology; innovation; science of science; sociology of science.


Conflict of interest statement

The authors declare no conflict of interest.

Figures

Fig. S1.
Fig. S1.
Chemical examples from the published network. Central estradiol and cholesterol molecules were linked when hormone therapies were found to have no effect on reducing heart disease (PMID 10954759 and 12904517). RNA and zinc (PMID 4040853) were recombined in the discovery of “zinc fingers” of amino acids, which are essential for gene regulation and ribosome synthesis. Bromodeoxyuridine, which replaced thymidine in DNA and so “labeled” replicated DNA, allowed scientists to discover cell division in the adult hippocampus (PMID 9809557). HIV therapeutics zidovudine, indinavir, stavidine, and lamivudine were combined in clinical trials of promising antiretroviral mixtures (PMID 9287227). Commercially available protein kinase inhibitors, including KT 5720, rottlerin, quercetin, wortmannin, and the more recently discovered Y 27632, were tested against an array of protein kinases (PMID 10998351).
Fig. S2.
Fig. S2.
Detailed chemical examples that illustrate different dimensions of chemical distance by tracing molecules and relationships along the shortest path between discoveries. (A) The Canadian discovery (in an article with PubMed ID or PMID 8581159) of a biosynthetic connection between antibiotics jadomycin B and rabelomycin, which illustrates how chemical distances in the network can map onto underlying geographic, linguistic, or cultural distances that keep molecules studied in “distant” laboratories from being combined. (B) A Bristol-Myers Squibb investigation (PMID 8443148) that tested the ability of BMY 42393 and Octimibate to reduce cholesterol and triglyceride levels in hamsters fed with chow, cholesterol, and coconut oil. This illustrates the diversity of chemical linkages—methodological, interactional, similarity, etc.—traced by our chemical network.
Fig. S3.
Fig. S3.
(A, Top and Middle) The distribution of node degrees for each pair of chemicals in MEDLINE abstracts and in abstracts authored by prize-winning scientists (SI Text). The (log-)degree of the most and least central chemicals of each pair is normalized to [0,1] and the height of the figure represents the frequency with which each pair of chemical degrees appears in the literature. All degrees are evaluated on the full (2010) network. (A, Bottom)The “Citations” subplot shows citation counts greater and smaller than average in red and blue, respectively; the red scale has been set to the same maximum value as the blue to improve contrast. (A, Middle) The combined figure reveals how less common degree–degree combinations are more intensely cited than common degree–degree combinations. (B) Distribution of network distances between each pair of chemicals in MEDLINE abstracts and in abstracts written by prize winners. All distances were evaluated at time of linking; frequencies have been transformed to log10-scale. distance indicates two chemicals that are mutually unreachable—disconnected—in the current network. The red and purple bands tracing the distributions are the 95% confidence intervals, constructed by considering the actual distribution of shortest paths as a sample from an underlying multinomial distribution (SI Text). Prize winners combine disconnected molecules significantly more frequently than others.
Fig. S4.
Fig. S4.
(A) Annotated version of the generative model. (B) A simple network example, which calculates the probability associated with possible node connections. (C) The probability of choosing nodes separated by distance di,j, given different values of β and γ. (D) The probability that a scientist would investigate the relationship between X and Y, X and Z, and Y and Z in Fig. S4B, given different values of αμ, αι, β, γ, and δ.
Fig. S5.
Fig. S5.
Degree–degree preference plots: empirical and alternative preferences. The x and y axes of each subplot correspond to the maximum and the minimum degree in a degree pair. The preferences (defined only by parameters αμ and αι; Fig. S4 and Eq. S5) are normalized so that the maximum preference on the plot is equal to 1 (white) and the minimum (if distinct from the maximum) is 0 (black). The first panel corresponds to the degree–degree preferences induced from data. Other panels compare this with alternative “strategies” or preferences.
Fig. S6.
Fig. S6.
(A) Infinite distances (δ parameter, estimated separately) over time. (B) Entropy of distance distributions (bits) as a function of time. As both distance distributions become more concentrated near distance 1, entropy decreases with time. Note that there are bursts of entropy that correlate across patents and biomedical publications and correspond with the bursts of jumps pictured in A. (C) Estimated preferences for finite distances (defined by β and γ parameters) in model estimated from data. (D) Distribution of measured distances as a function of time. MEDLINE and Patents become more conservative over time, restricting distance between chemicals selected. Researchers patent pairs with shorter distances than articles (Table 1).
Fig. 1.
Fig. 1.
Red lines show model parameters estimated from the network of published chemical relationships over historical time, 1975–2010, every 5 y. The preference for more central chemicals (αμ, αι) increases consistently over time. The parameters controlling preference for walk length (β,γ) and for jumping to disconnected network components (δ) also decrease consistently between 1975 and 2010, although the interpretation is somewhat subtle (main text). The green lines illustrate the optimal 10%, 20%, 30%, 40%, 50%, 60%, 70%, 80%, 90%, and 100% strategies against the historical trend and highlight the contrast between the trajectories.
Fig. S7.
Fig. S7.
Degree-distribution-preserving random sample drawn from the complete MEDLINE network. Note that most of the chemicals in this sample happen to be herbicides; these substances are relevant to biomedicine because of their implications for human health. Also note that very high-degree network nodes (e.g., water) are at the periphery and predominantly connected to chemicals beyond the sample.
Fig. S8.
Fig. S8.
The degree distribution (green) and cumulative degree distribution (blue) for the MEDLINE–Patent network. Maximum-likelihood fits to a log-normal distribution are shown.
Fig. S9.
Fig. S9.
The degree distribution (green) and cumulative degree distribution (blue) for the forest fire sample network used in searching for efficient strategies.
Fig. S10.
Fig. S10.
The degree distribution (green) and cumulative degree distribution (blue) for the model network used in visualizations (Fig. 2 B–D).
Fig. 2.
Fig. 2.
(A) Comparison of the efficiency of discovery for different search strategies. Efficiency is quantified as the estimated number of experiments required to discover from 1% to 100% of a representative sample of the 2010 MEDLINE network. Compared strategies include random choice, the inferred MEDLINE strategy, and optimal strategies for discovering 20%, 50%, and 100% of the network. Results show that contemporary scientific activity (MEDLINE) may have been nearly optimal for discovering 10% of the chemical network, but becomes increasingly inefficient for discovering more than 30%. Parameters for “optimal” strategies are drawn from multistage collections of simulated annealing and subsequent MCMC search procedures. (B–D) Actual and optimal search processes illustrated on a planar network of chemical relationships. Each panel represents the average from 500 independent runs of the strategy, at the point where 25% of the possible chemical relationships have been discovered. The node and edge legends for each network strategy (Upper Right and Lower Right of each panel) are normalized to highlight differences between the strategies and are paired with histograms to illustrate the frequencies with which chemicals and chemical relationships of various degree centralities are selected for experimentation. Panels compare the strategies used by biomedical scientists publishing MEDLINE-indexed articles with alternative strategies that most efficiently discover the first 50% or 100% of the network.
Fig. S11.
Fig. S11.
Comparison of coordinated and uncoordinated strategies to one another. Strategy efficiencies are normalized against the efficiency of the random, uncoordinated strategy (Nrandom/Nfocalstrategy), where Nstrategy is the number of experiments required to discover from 1% to 100% of the network. As a result, the vertical axis shows how many times more efficient a given strategy is than the random, uncoordinated strategy.

References

    1. Kleinberg J, Oren S. Mechanisms for (Mis)Allocating Scientific Credit, STOC ’11. Association for Computing Machinery; New York: 2011. pp. 529–538.
    1. Foster JG, Rzhetsky A, Evans JA. Tradition and innovation in scientists’ research strategies. Am Sociol Rev. 2015;80(5):875–908.
    1. Weisberg M, Muldoon R. Epistemic landscapes and the division of cognitive labor. Philos Sci. 2009;76(2):225–252.
    1. Mason W, Watts DJ. Collaborative learning in networks. Proc Natl Acad Sci USA. 2012;109(3):764–769. - PMC - PubMed
    1. Tria F, Loreto V, Servedio VDP, Strogatz SH. The dynamics of correlated novelties. Sci Rep. 2014;4:5890. - PMC - PubMed

Publication types

LinkOut - more resources